
Building the Data Foundation for Mass Valuation in the Turks and Caicos Islands
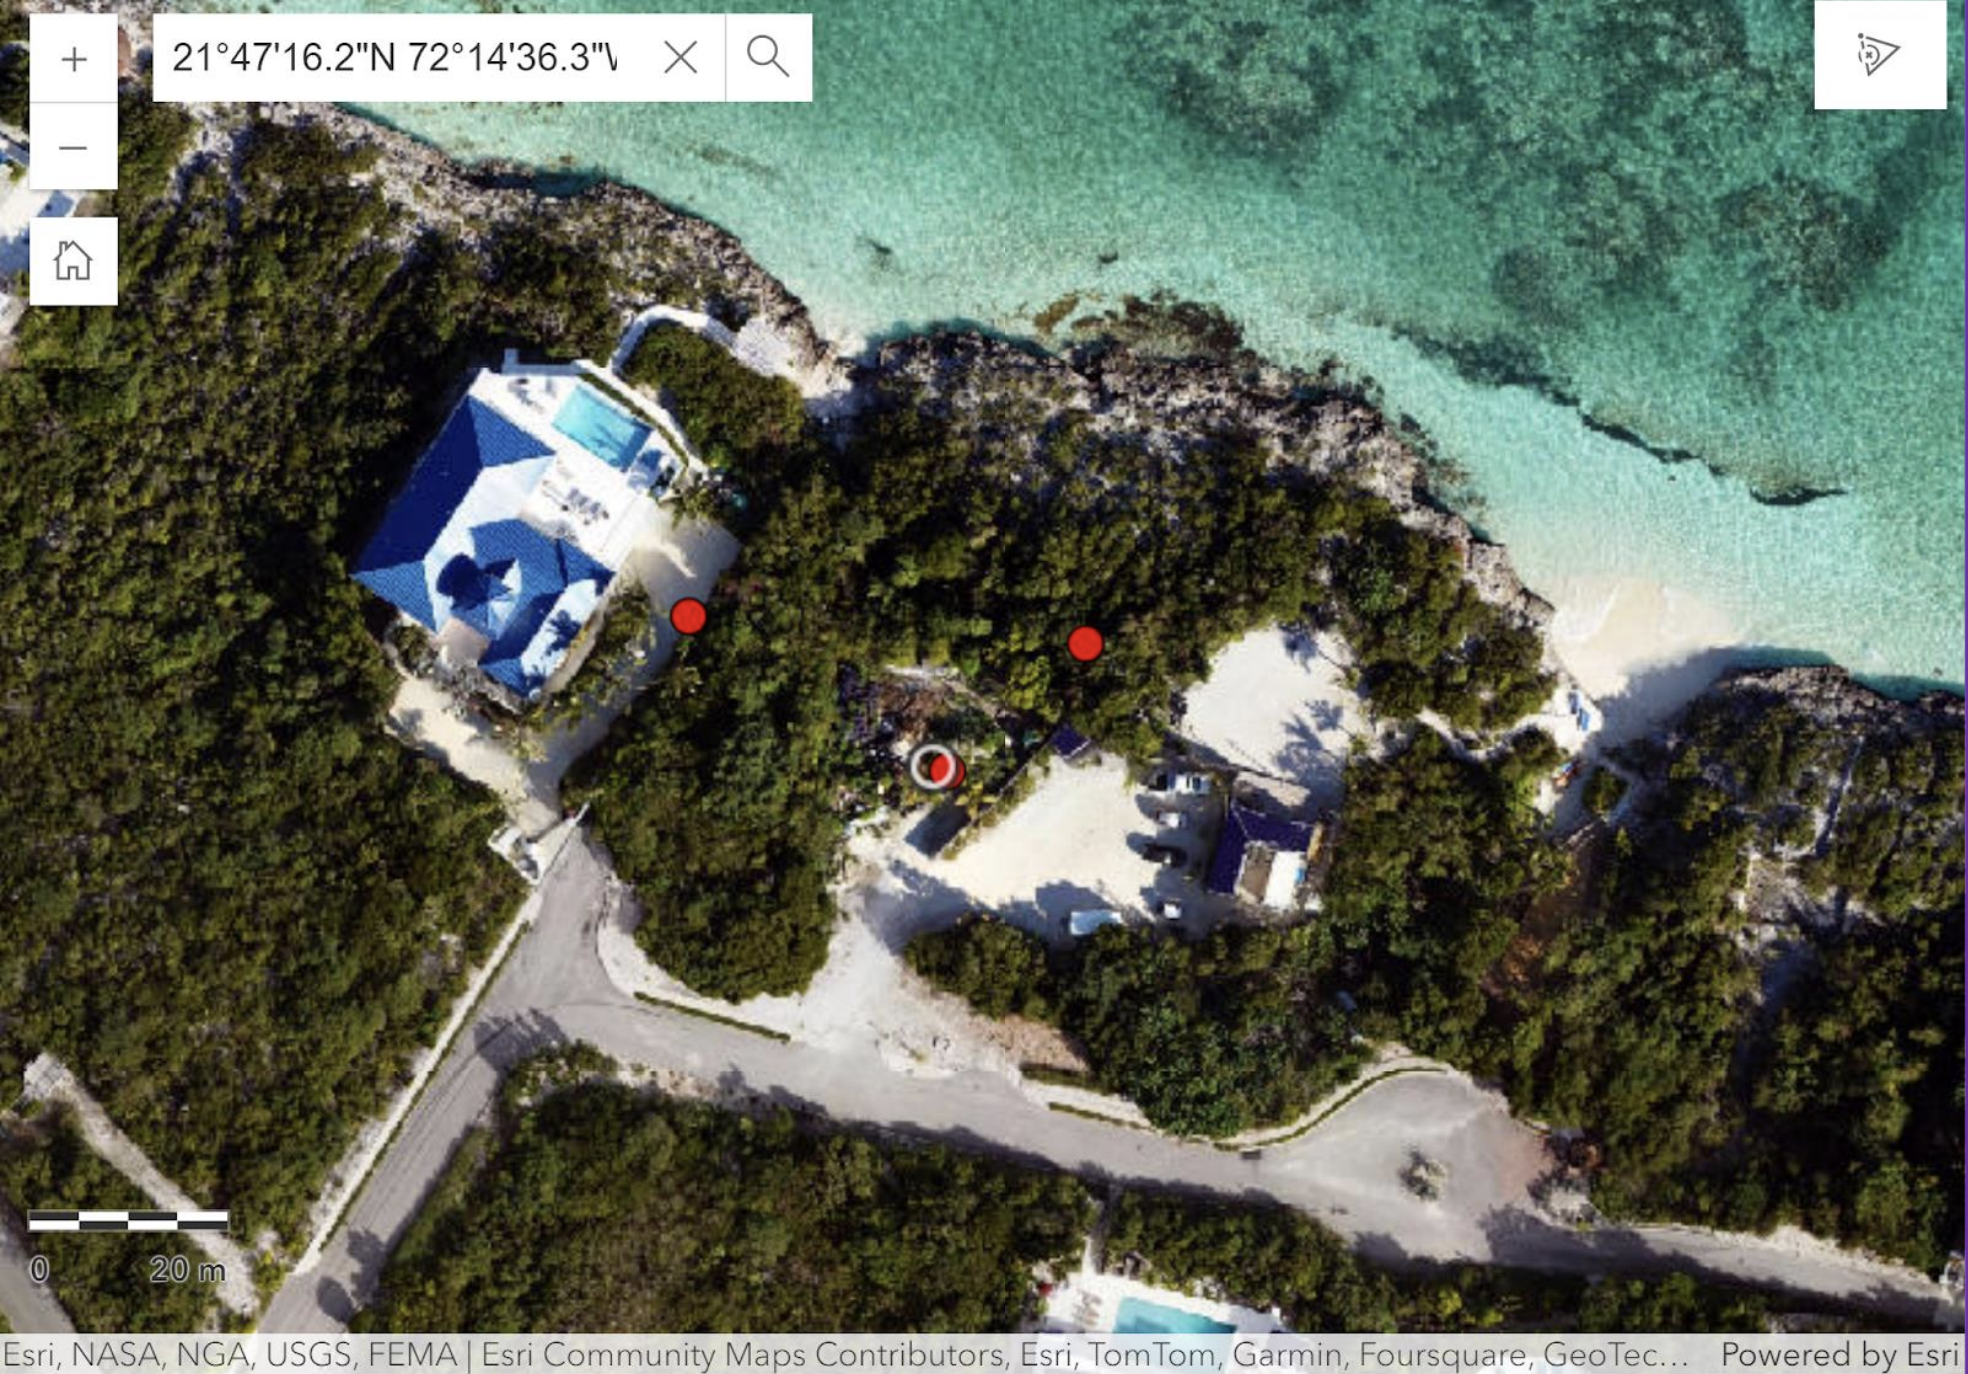
Image by PLACE Imagery (thisisplace.org)
Property taxation could not function without good property data. At a basic level, an administration needs to know what properties exist, where they are located, what their physical characteristics are, who or what is liable for the tax, and, in an ad valorem system, what those properties are worth. The more accurate, complete, current, and comprehensive those data are, the better mass valuation models will typically perform and the more efficiently the broader property tax system can operate.
Property data are the ingredients of the property tax system.A mass valuation model does not know whether the information it receives is complete, current, or correct. It estimates relationships from the data it is given and applies those relationships to the property records it is given. If the underlying information does not accurately describe the market or the properties being valued, the resulting values can reflect those problems. More sophisticated modeling cannot fully compensate for information that is unavailable, incomplete, out of date, or incorrect.
These data problems can arise in many ordinary ways. A characteristic may never have been collected. A new building, addition, demolition, pool, or other physical change may not yet have been recorded. Information may be incomplete, or an otherwise reliable field may contain an error introduced through data entry, scanning, transcription, conversion from older records, or other routine administrative processes. These are common challenges in property administration and can accumulate over time, particularly where offices have operated for years or decades with limited staff, technology, funding, or opportunities for systematic data maintenance.
In mass valuation, these problems can affect results at two closely connected stages: when the model learns from the market and when the resulting model is applied to the tax base.
First, market transactions are used to estimate how physical characteristics, location, and other property attributes contribute to market value. A correct market price tied to incorrect property characteristics can distort those relationships. If a property sold for $1 million but its record substantially understates its finished living area, lot size, bathroom count, age, or another important characteristic, the model is being asked to explain the correct price using an incorrect description of the property. When these errors occur throughout the market data used for model development, the relationships estimated by the model can also become distorted.
The second stage occurs when those estimated relationships are applied to the much larger universe of properties in the cadastre. Most properties receiving taxable values will not have sold during the period used to estimate the model, so their valuations depend on the characteristics maintained in the property database. If a house actually contains 4,000 square feet of finished living area but the database records 2,500, the model cannot value space it has not been told exists. If an older dwelling has been demolished and replaced by a substantially larger and more valuable home, but the cadastre still describes the former improvement, the property may continue to be valued and taxed according to a building that is no longer on the ground.
Missing, incomplete, inaccurate, and outdated information can therefore affect more than individual valuations. If data problems differ systematically by neighborhood, property type, or value range, they can contribute to horizontal and vertical inequity across the tax base. Once values are issued, these problems can also lead to corrections, taxpayer inquiries, appeals, additional staff requirements, potential legal costs, and reduced public confidence in the valuation system.
Better data therefore provide a stronger basis for accurate and equitable taxable values, while limitations in the underlying information place limits on what even sophisticated statistical methods can produce. In modeling, this is often summarized as “garbage in, garbage out”. This emphasis on data quality is well established in mass appraisal practice; IAAO guidance similarly emphasizes reliable market data, property characteristics, and quality control.
For jurisdictions introducing or modernizing mass valuation, current aerial and street-level imagery can provide another source of information for addressing some of these problems. It can help verify the market and property information used to develop models, identify important characteristics that are absent from existing records, and help keep the broader cadastre current so that resulting models are applied to properties that are accurately described.
The Turks and Caicos Islands exercise provided a practical demonstration of these uses.
Mass Valuation Proof of Concept for Turks and Caicos
For governments preparing for mass valuation, some important decisions come before a production model is ever built. Is the available market information sufficient to begin modeling? Which property characteristics appear to matter most? Where are the important gaps in the existing property database? And where should limited time and resources for data collection and quality control be concentrated?
Turks and Caicos Islands provided an opportunity to explore these questions in practice. As the Islands prepared for mass valuation, CART and imagery nonprofit PLACE partnered on an exploratory proof-of-concept exercise using available market and property information. PLACE provided recent aerial and street-level imagery, while the analysis combined the available data with GIS, regression, machine learning, and ratio-study testing.
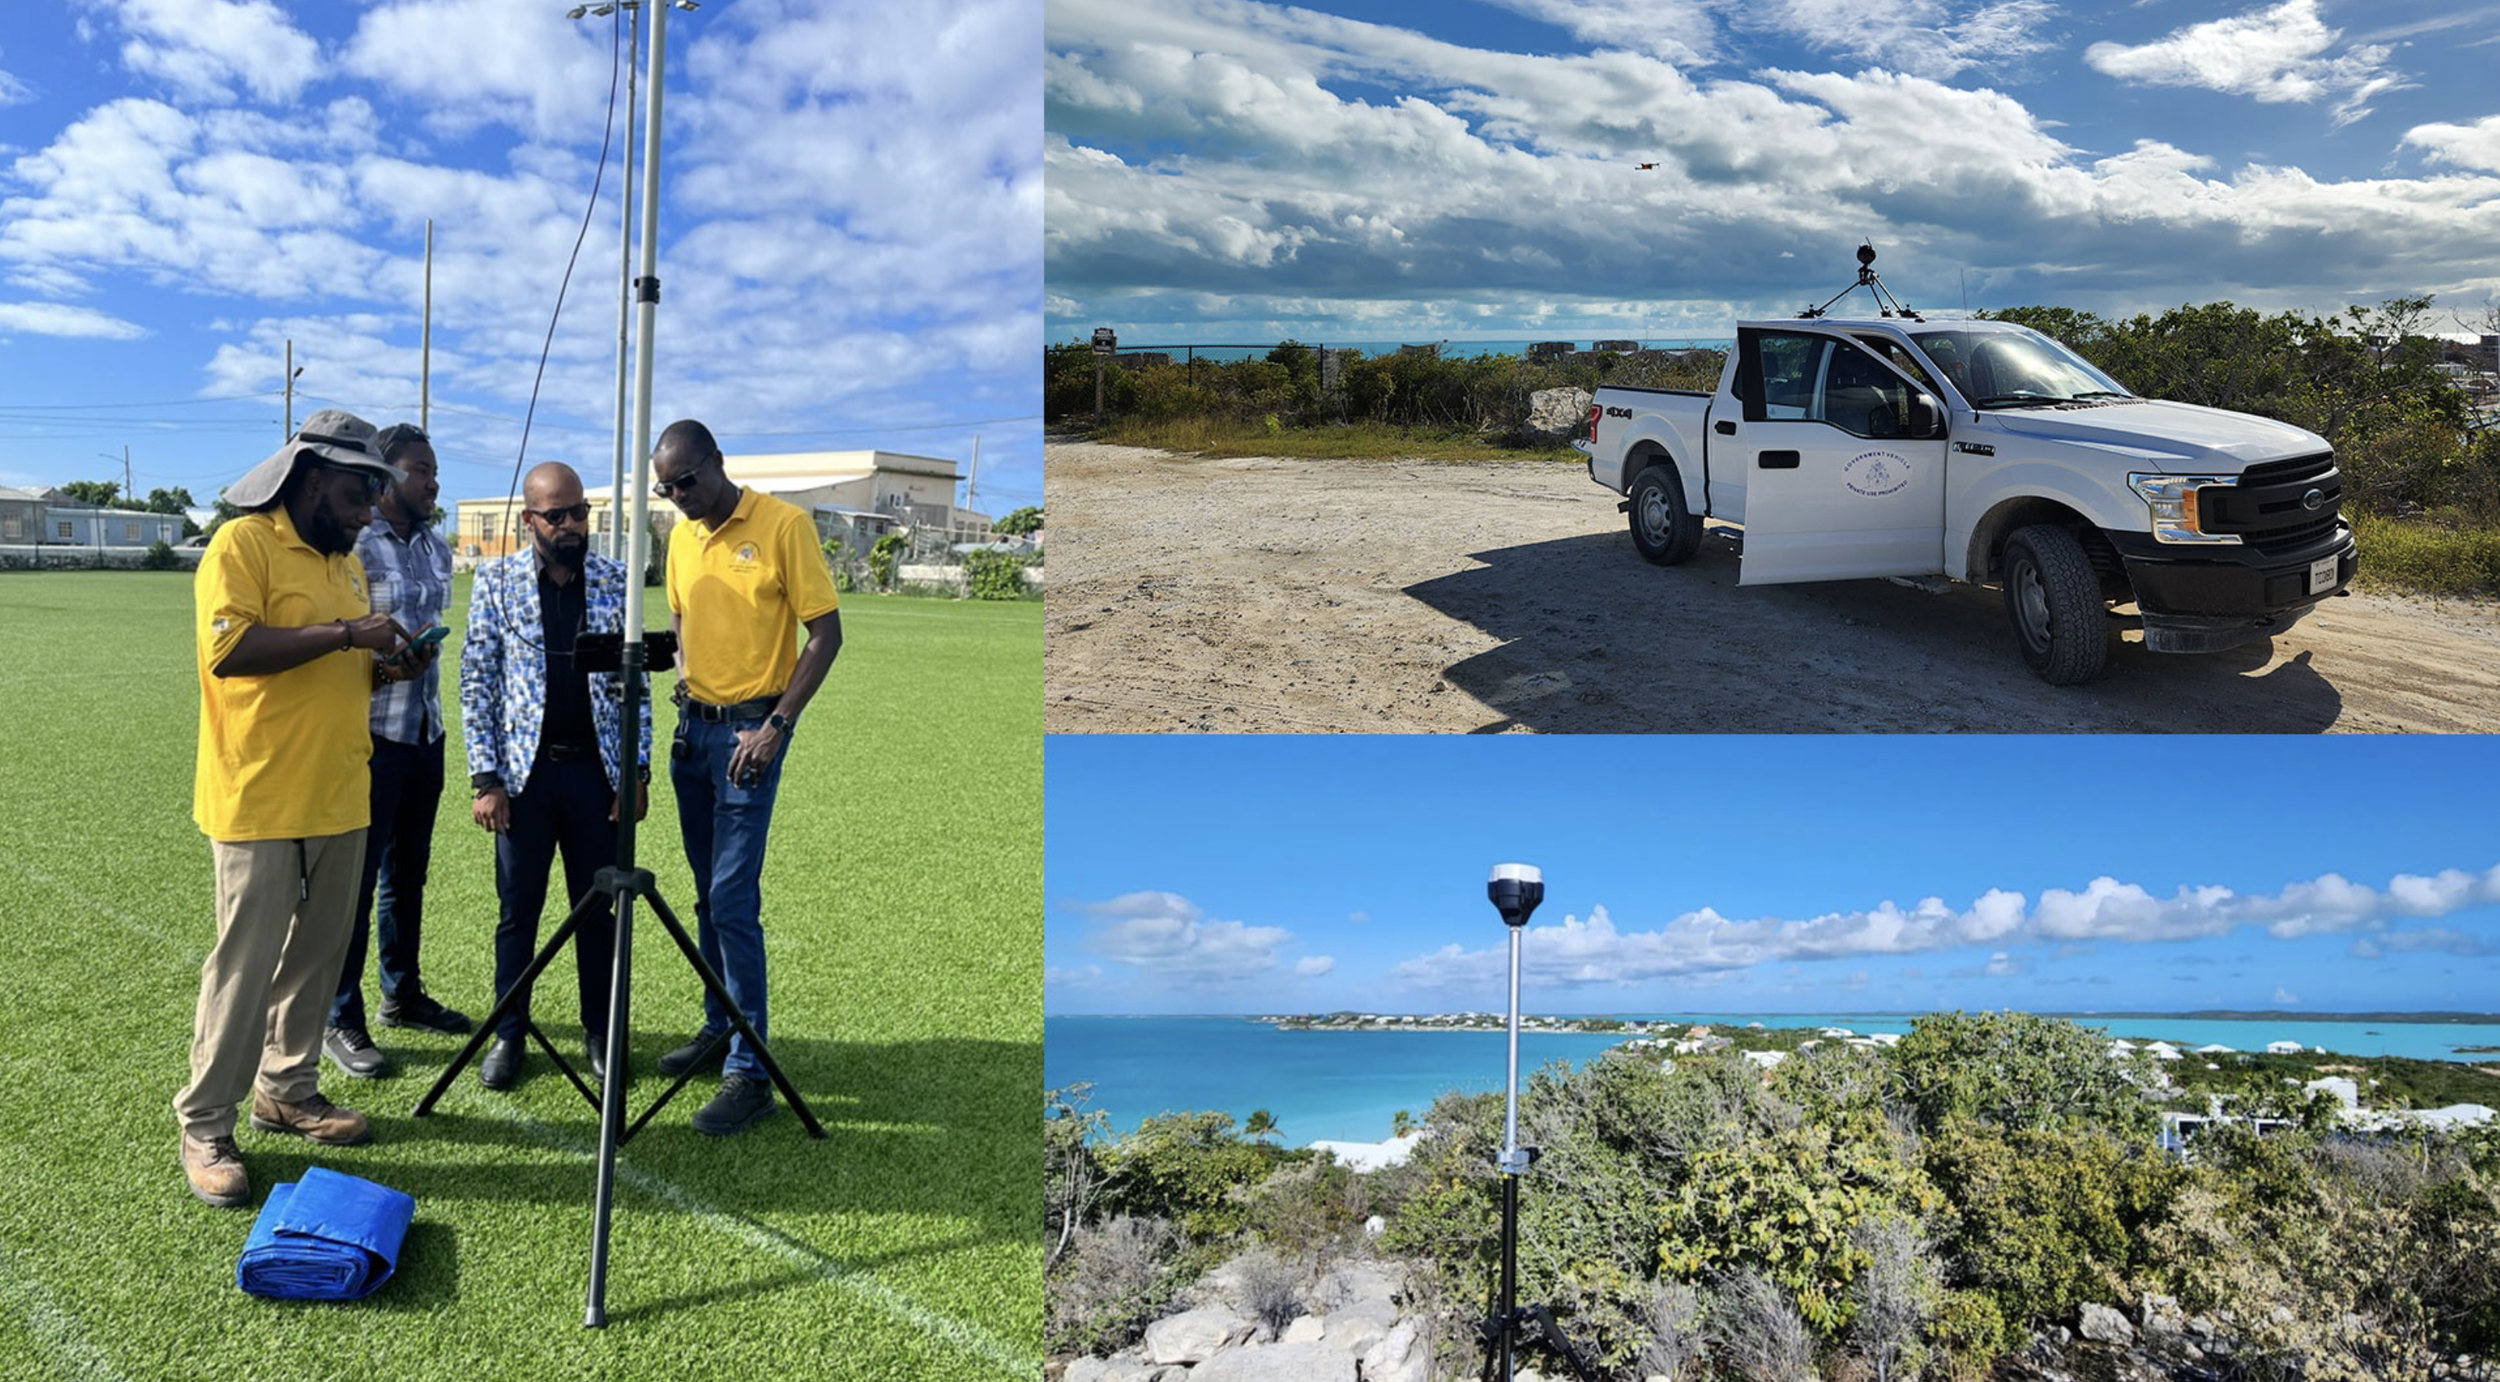
The exercise was deliberately fit for purpose. It was not a formal scientific study designed to produce statistically representative findings for the residential markets of the Turks and Caicos Islands, nor was it a comprehensive pilot test for an official mass valuation system. It used 138 single-family residential listings from local real estate listing source - concentrated among middle- and higher-value residential and vacation-oriented properties, and asking prices rather than a fully researched set of verified arm's-length transactions. The results should therefore be interpreted as exploratory findings rather than as estimates of how a production model would perform across the Islands.
The objective was to learn what could reasonably be learned at an early stage:
whether the available data contained recognizable market relationships that could be modeled mathematically;
whether current imagery could improve the underlying property data and resulting valuation analysis; and
which characteristics and data gaps appeared important enough to warrant greater attention as the property database and mass valuation system were developed.
A formal pilot intended to support implementation would come later and require considerably broader analysis and quality control, including a larger and appropriately representative body of market evidence, appropriate review and treatment of the market data used, systematic cadastral review, appropriate market and property stratification, model development and calibration, independent validation, ratio studies across relevant geographies, property groups, and value ranges, and detailed investigation of model errors and unusual observations.
A Note on Listing Data
Listing information can provide useful market evidence for exploratory modeling, particularly where sufficient verified transaction data are not available or where a jurisdiction wants an early indication of what its market and property data may support. Asking prices, however, should not automatically be treated as equivalent to verified arm's-length transaction prices or market value. IAAO's current mass appraisal standard emphasizes maintaining, reviewing, and validating sales data, while its sales-verification standard emphasizes determining whether transactions are arm's length and whether conditions require adjustment before use.
Where listing information is used, its relationship with actual transactions should be examined whenever possible. If asking prices in a particular market are typically five percent higher than eventual transaction prices, for example, that relationship may need to be quantified and accounted for. The representativeness of the listings should also be considered, particularly where certain locations, property types, or portions of the value distribution are more likely to appear in the available data.
The appropriate use of listing information also depends on the jurisdiction and purpose. Governments should observe applicable laws and professional requirements governing the market evidence that may be used for valuation. Any collection or reuse of listing or other third-party data should also comply with applicable laws, licensing requirements, and terms governing access to and use of those data. IAAO standards are advisory and recognize that applicable law takes precedence where a conflict exists.
For this proof of concept, the listings provided a practical source of market information for a narrower purpose. They were not used to establish official taxable values. Rather, the exercise examined whether recognizable relationships between property characteristics and price were present in this segment of the market, which characteristics appeared most important, and whether providing the models with better information about the properties improved valuation performance.
Using Current Imagery to Check the Data
The first use of PLACE imagery was not to add new variables to the models. It was to help determine whether the observations already in the dataset accurately represented the properties being analyzed.
PLACE imagery and GIS were used to confirm that listings corresponded to residential properties at the identified locations and to identify potential mismatches for review. Properties that appeared to be vacant, non-residential, or otherwise inconsistent with the listing information could then be investigated and, where appropriate, removed from the modeling dataset.
The examples below show several of the data-quality issues identified during this review.
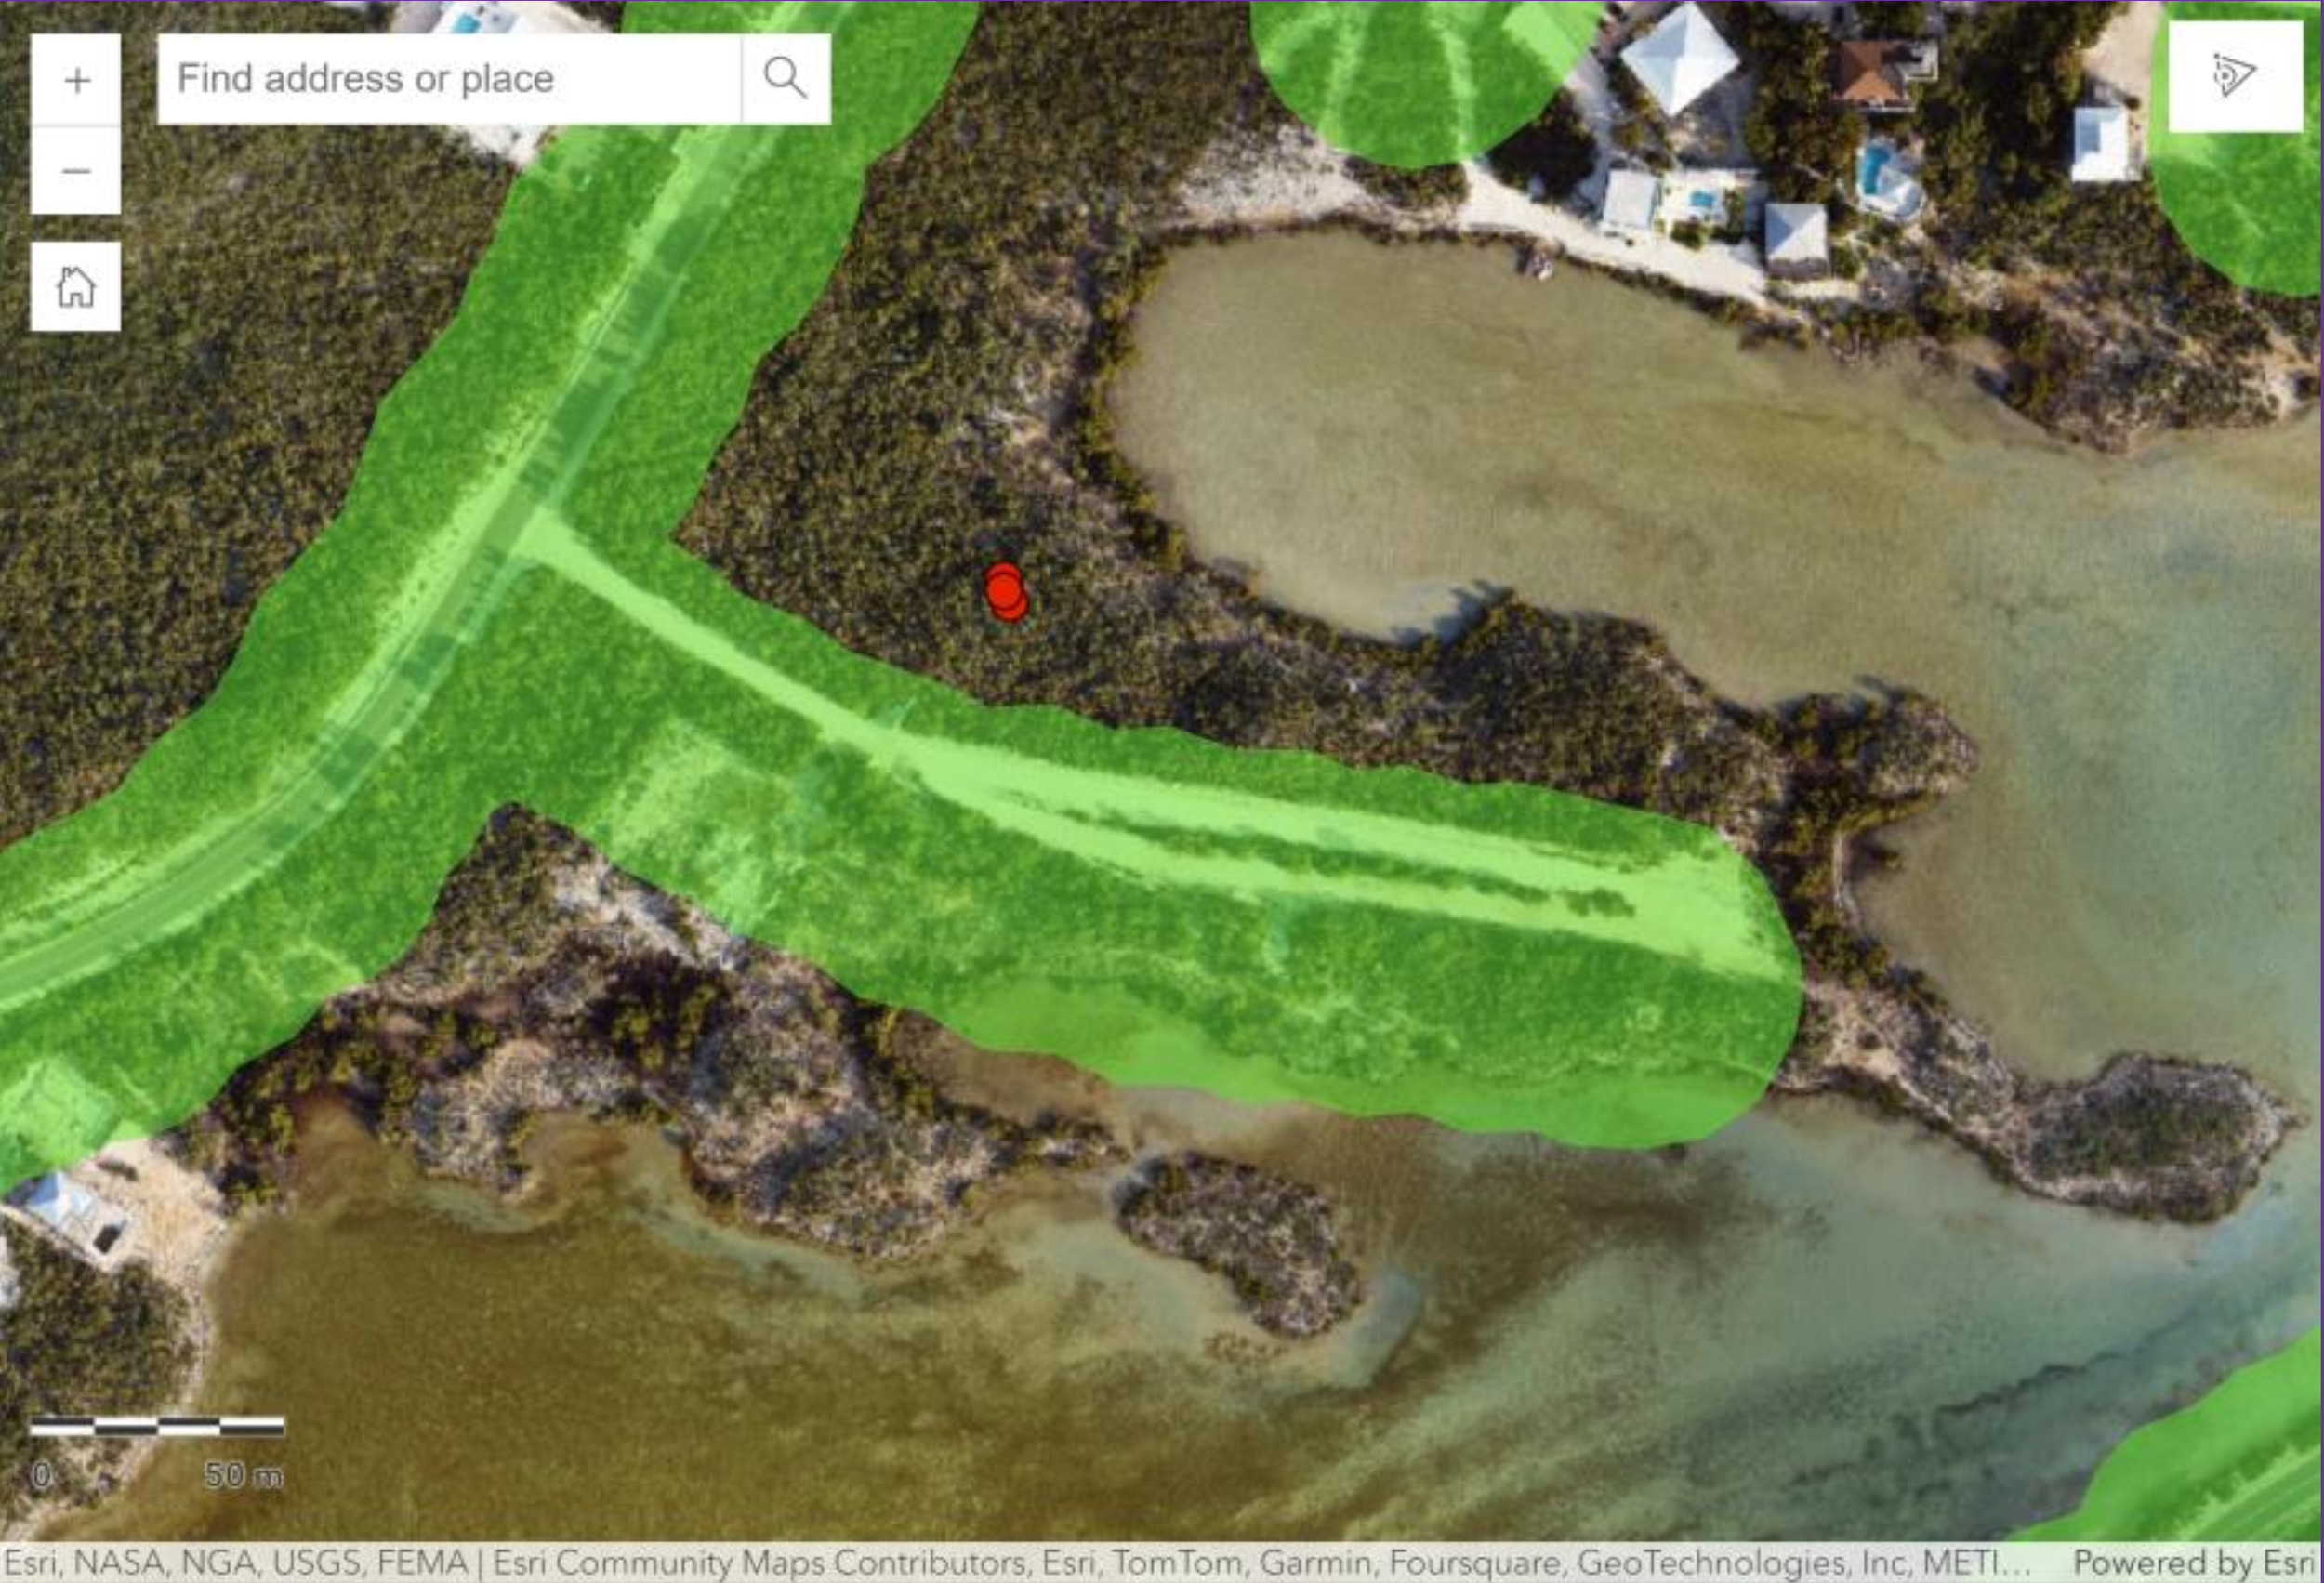
Transaction Database Mismatch Flag: Imagery at the recorded location coordinates for a residential property transaction appears to show vacant, undeveloped land.
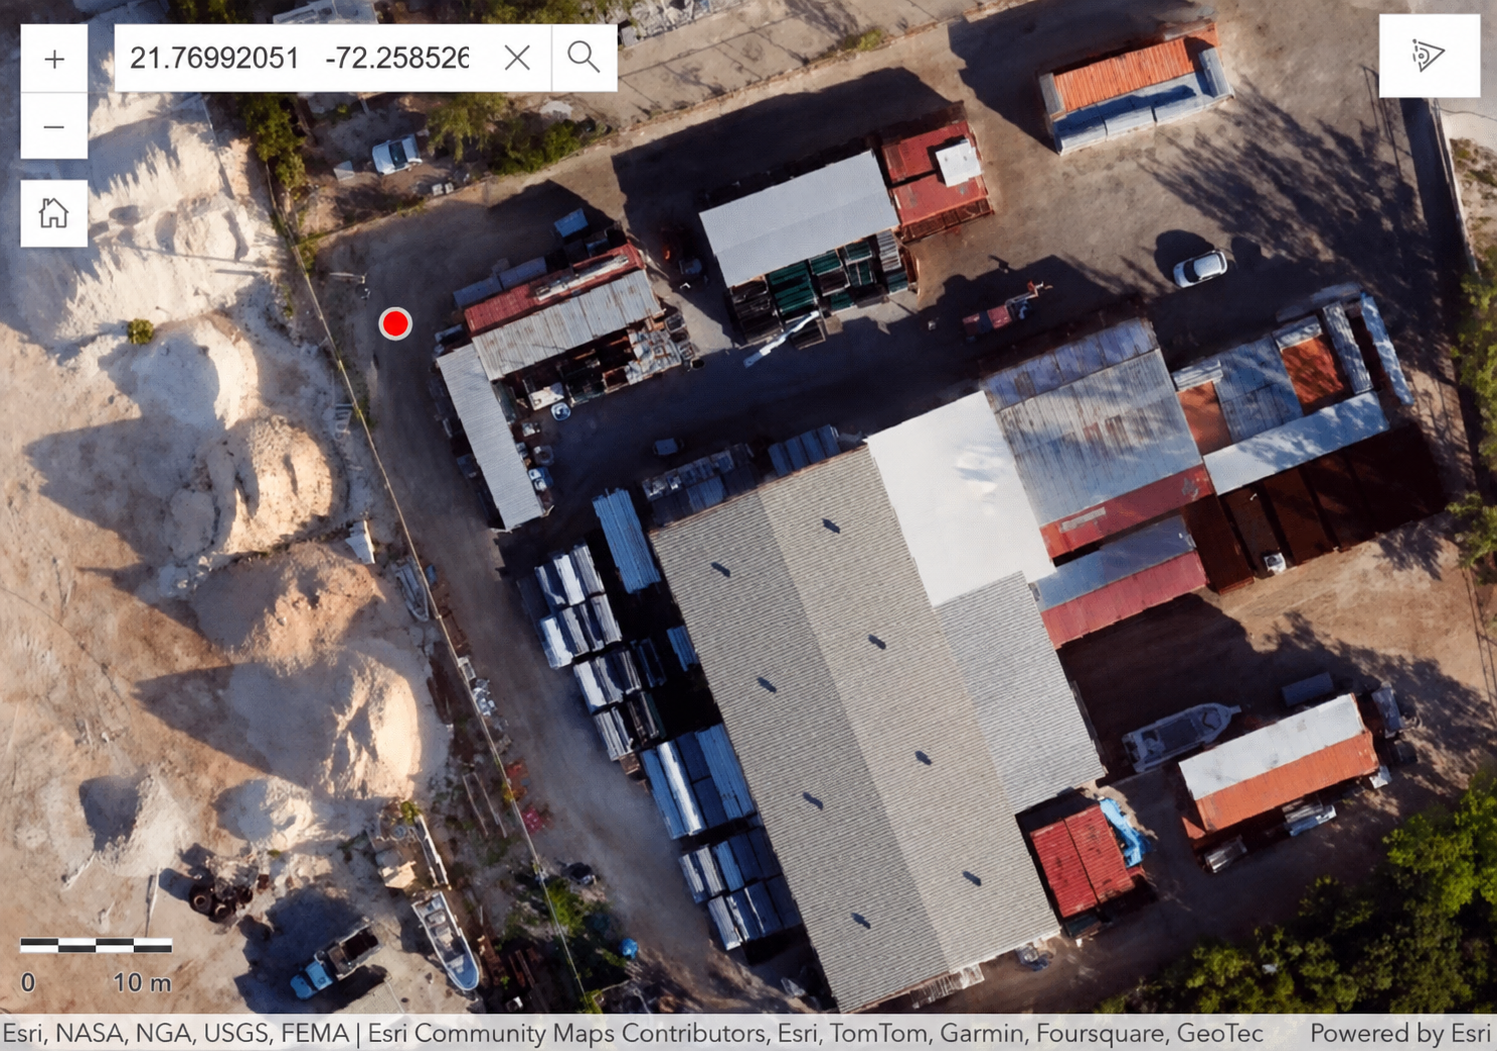
Transaction Database Mismatch Flag: Imagery at the recorded location coordinates for a residential property transaction appears to show commercial or industrial use.
This is an important part of mass valuation because a model can only learn from the observations supplied to it. If a market record is assigned to the wrong parcel, a vacant parcel is represented as an improved property, or the characteristics associated with a market observation describe the wrong building, those errors become part of the statistical relationships being estimated.
Current imagery provides an independent way to check whether the tabular record corresponds to what actually exists on the ground. In this exercise, it allowed questionable observations to be identified and reviewed before they were used to train the models.
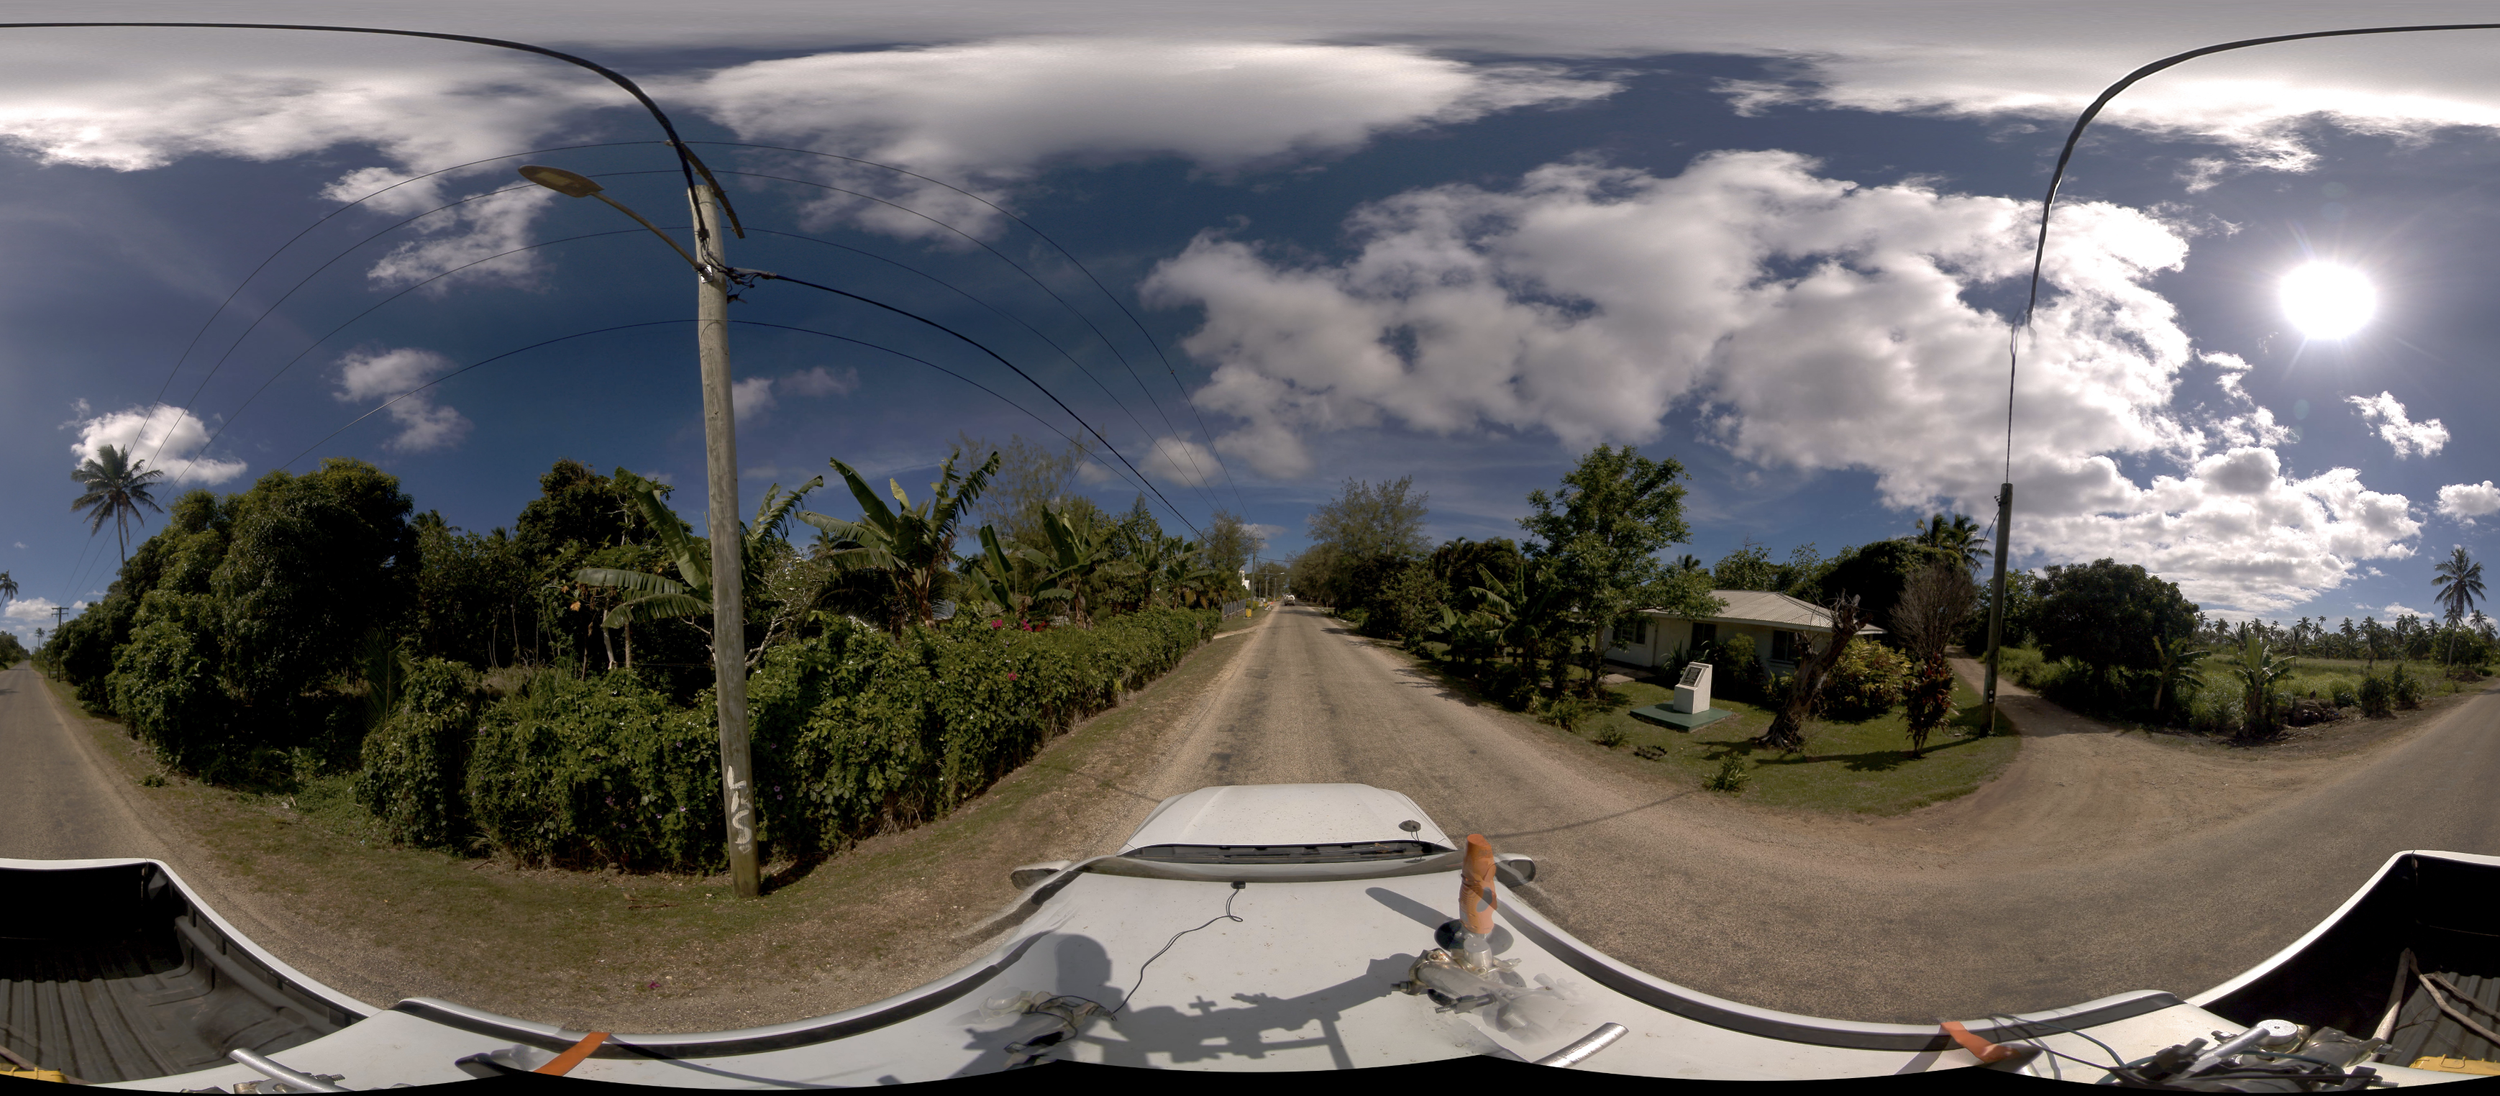
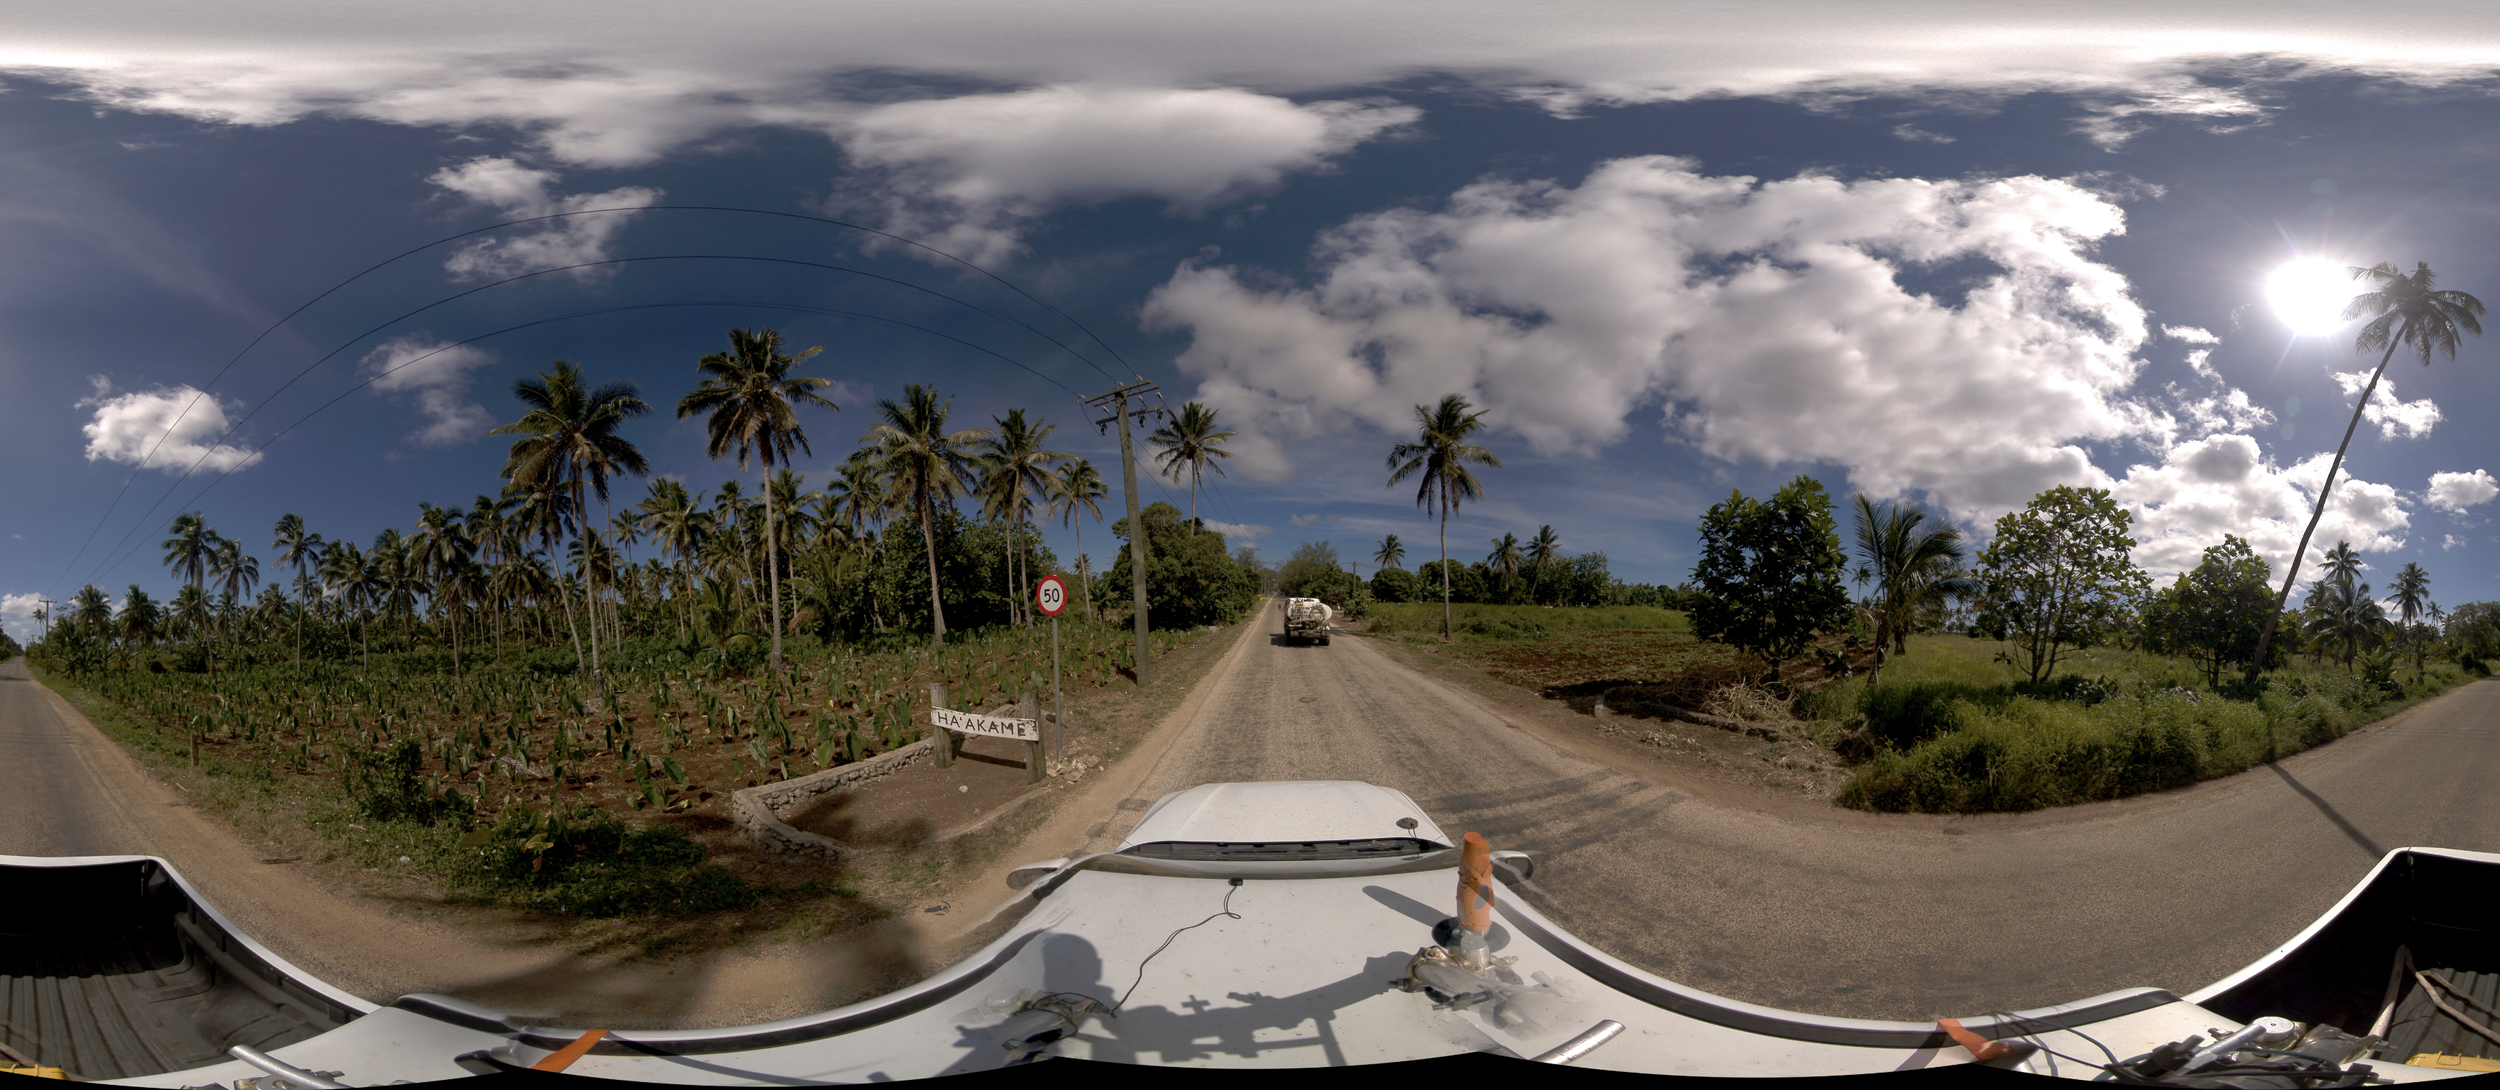
The importance of current imagery is particularly clear in a changing property market. The comparison examples showed newer construction, buildings, and completed roads visible in PLACE imagery that were not visible in other imagery available for the same locations. A property database cannot remain current if the information being used to verify it is itself several years behind what exists on the ground.
Using Imagery to Add Information the Models Did Not Have
PLACE imagery was then used to supplement the tabular records with property characteristics that were not consistently available in the listing data, including pool status, oceanfront status, Chalk Sound waterfront status, and canal or channel waterfront status.

Sale with Pool
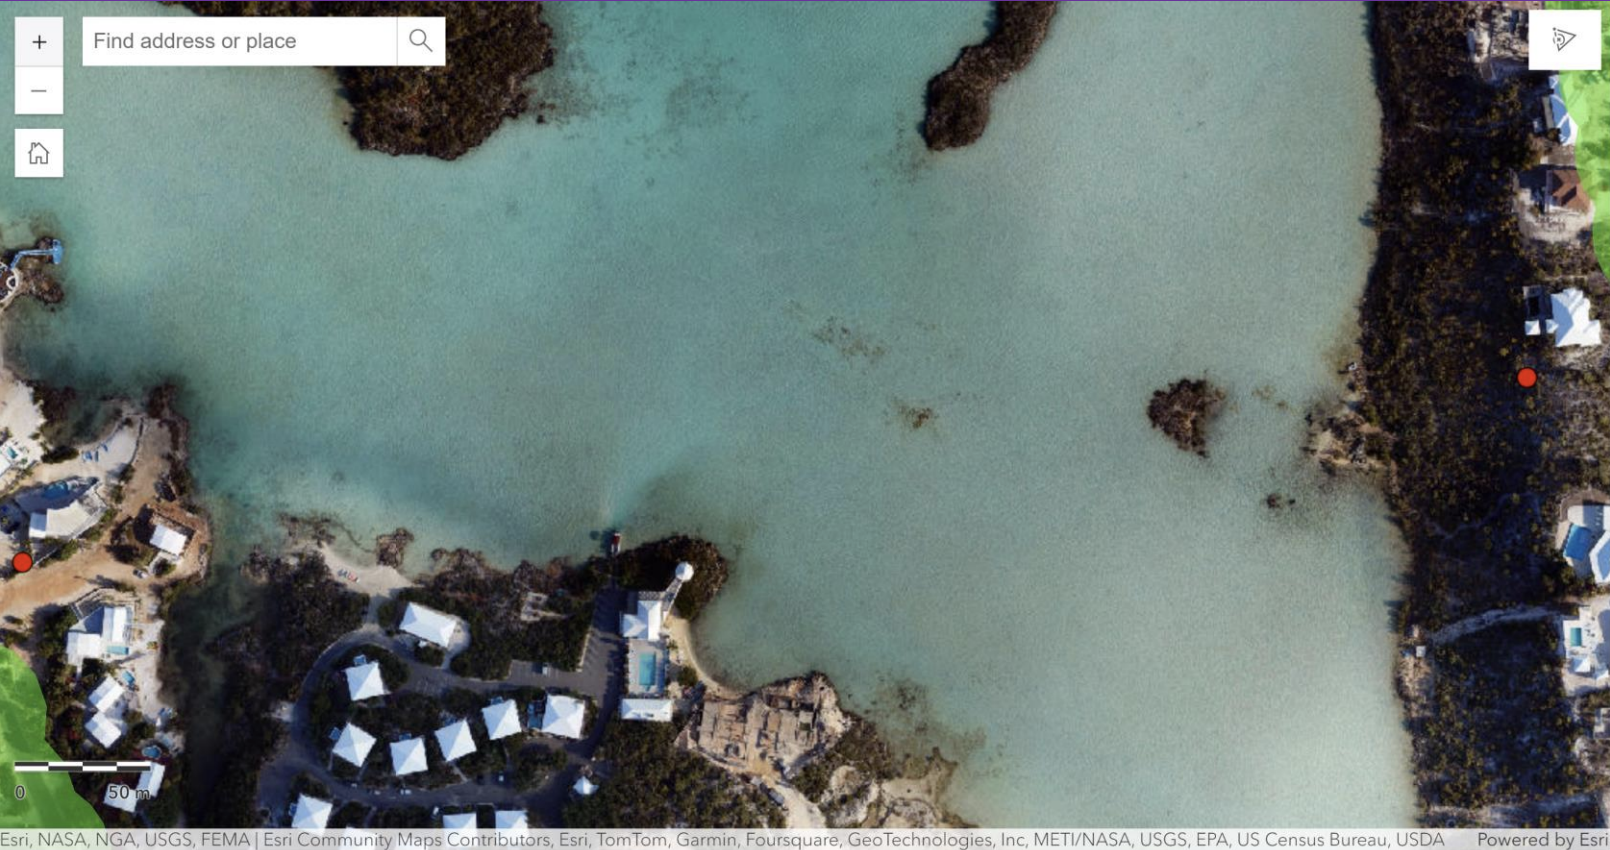
Sales on Chalk Sound
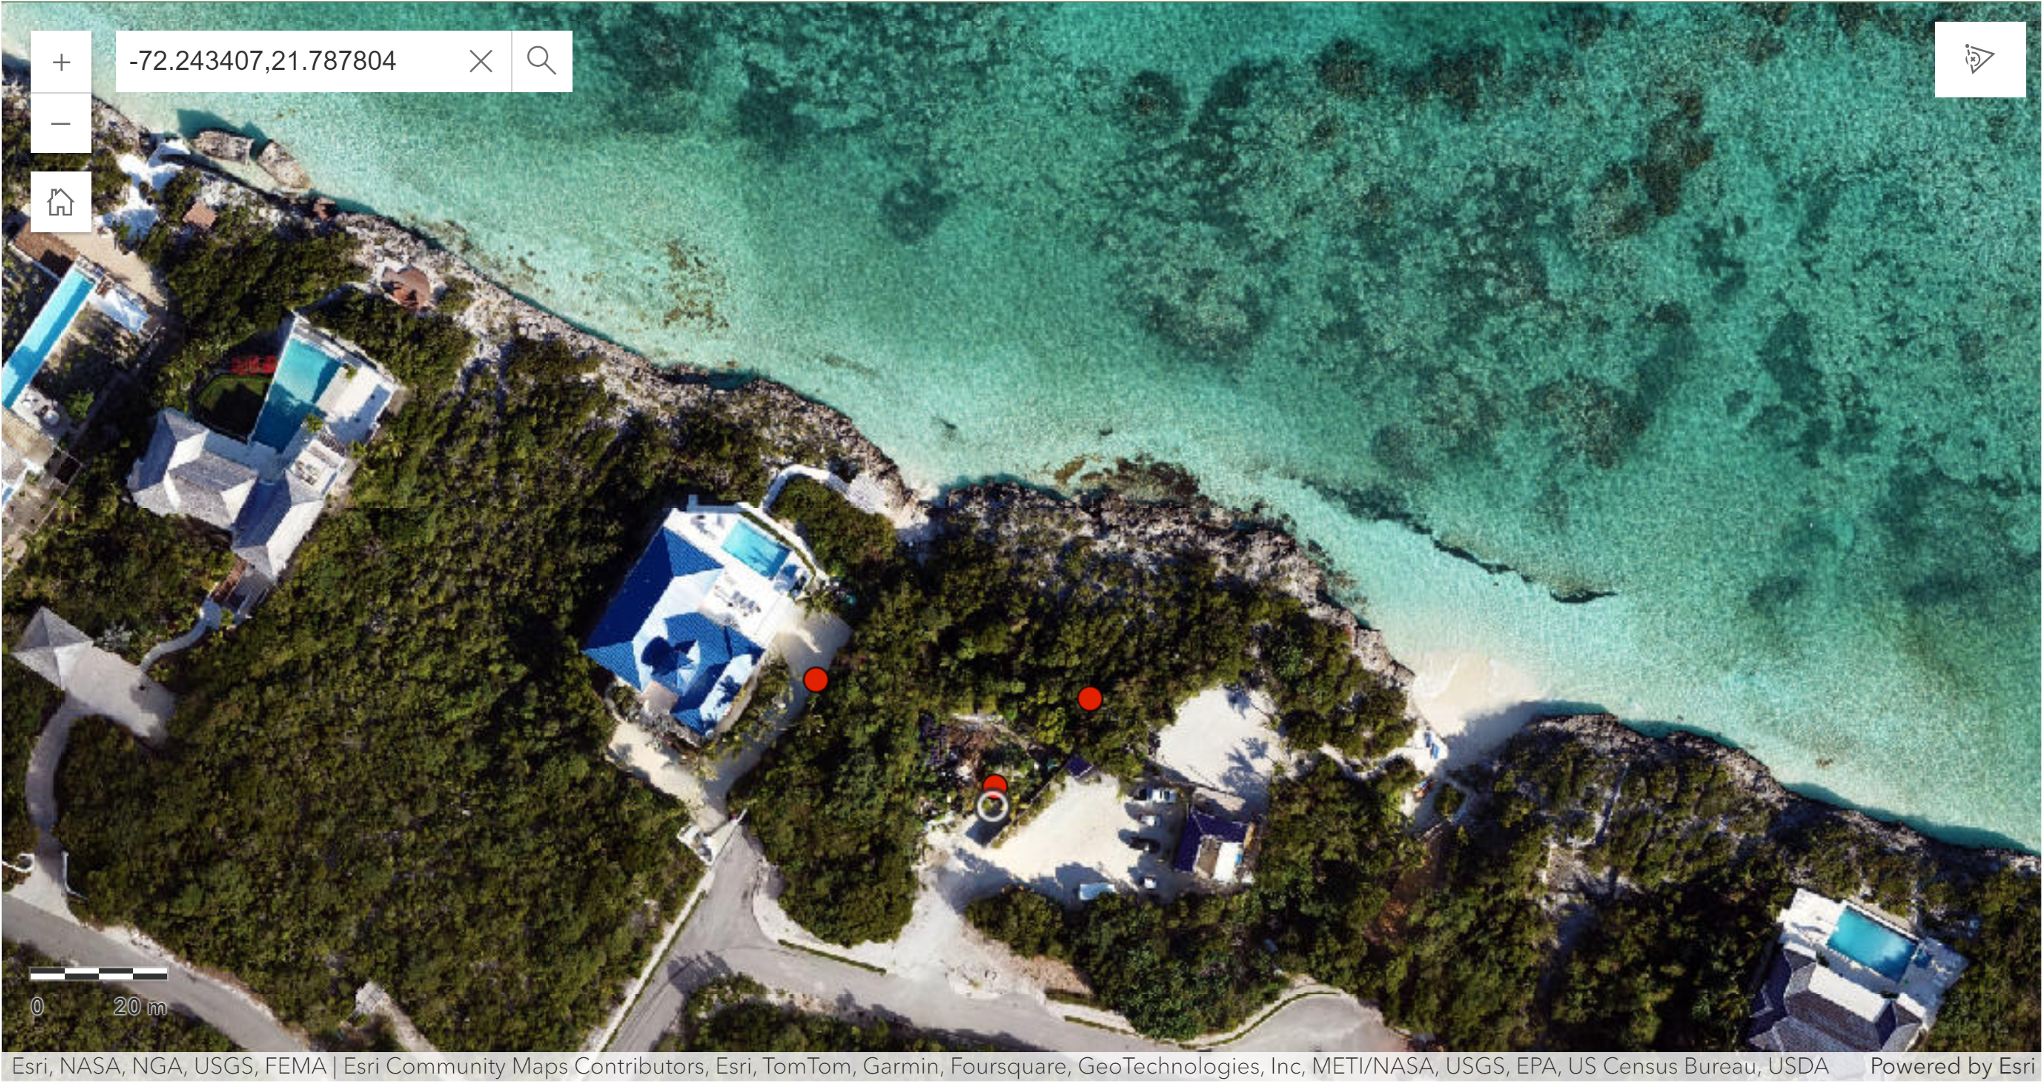
Sales on Oceanfront
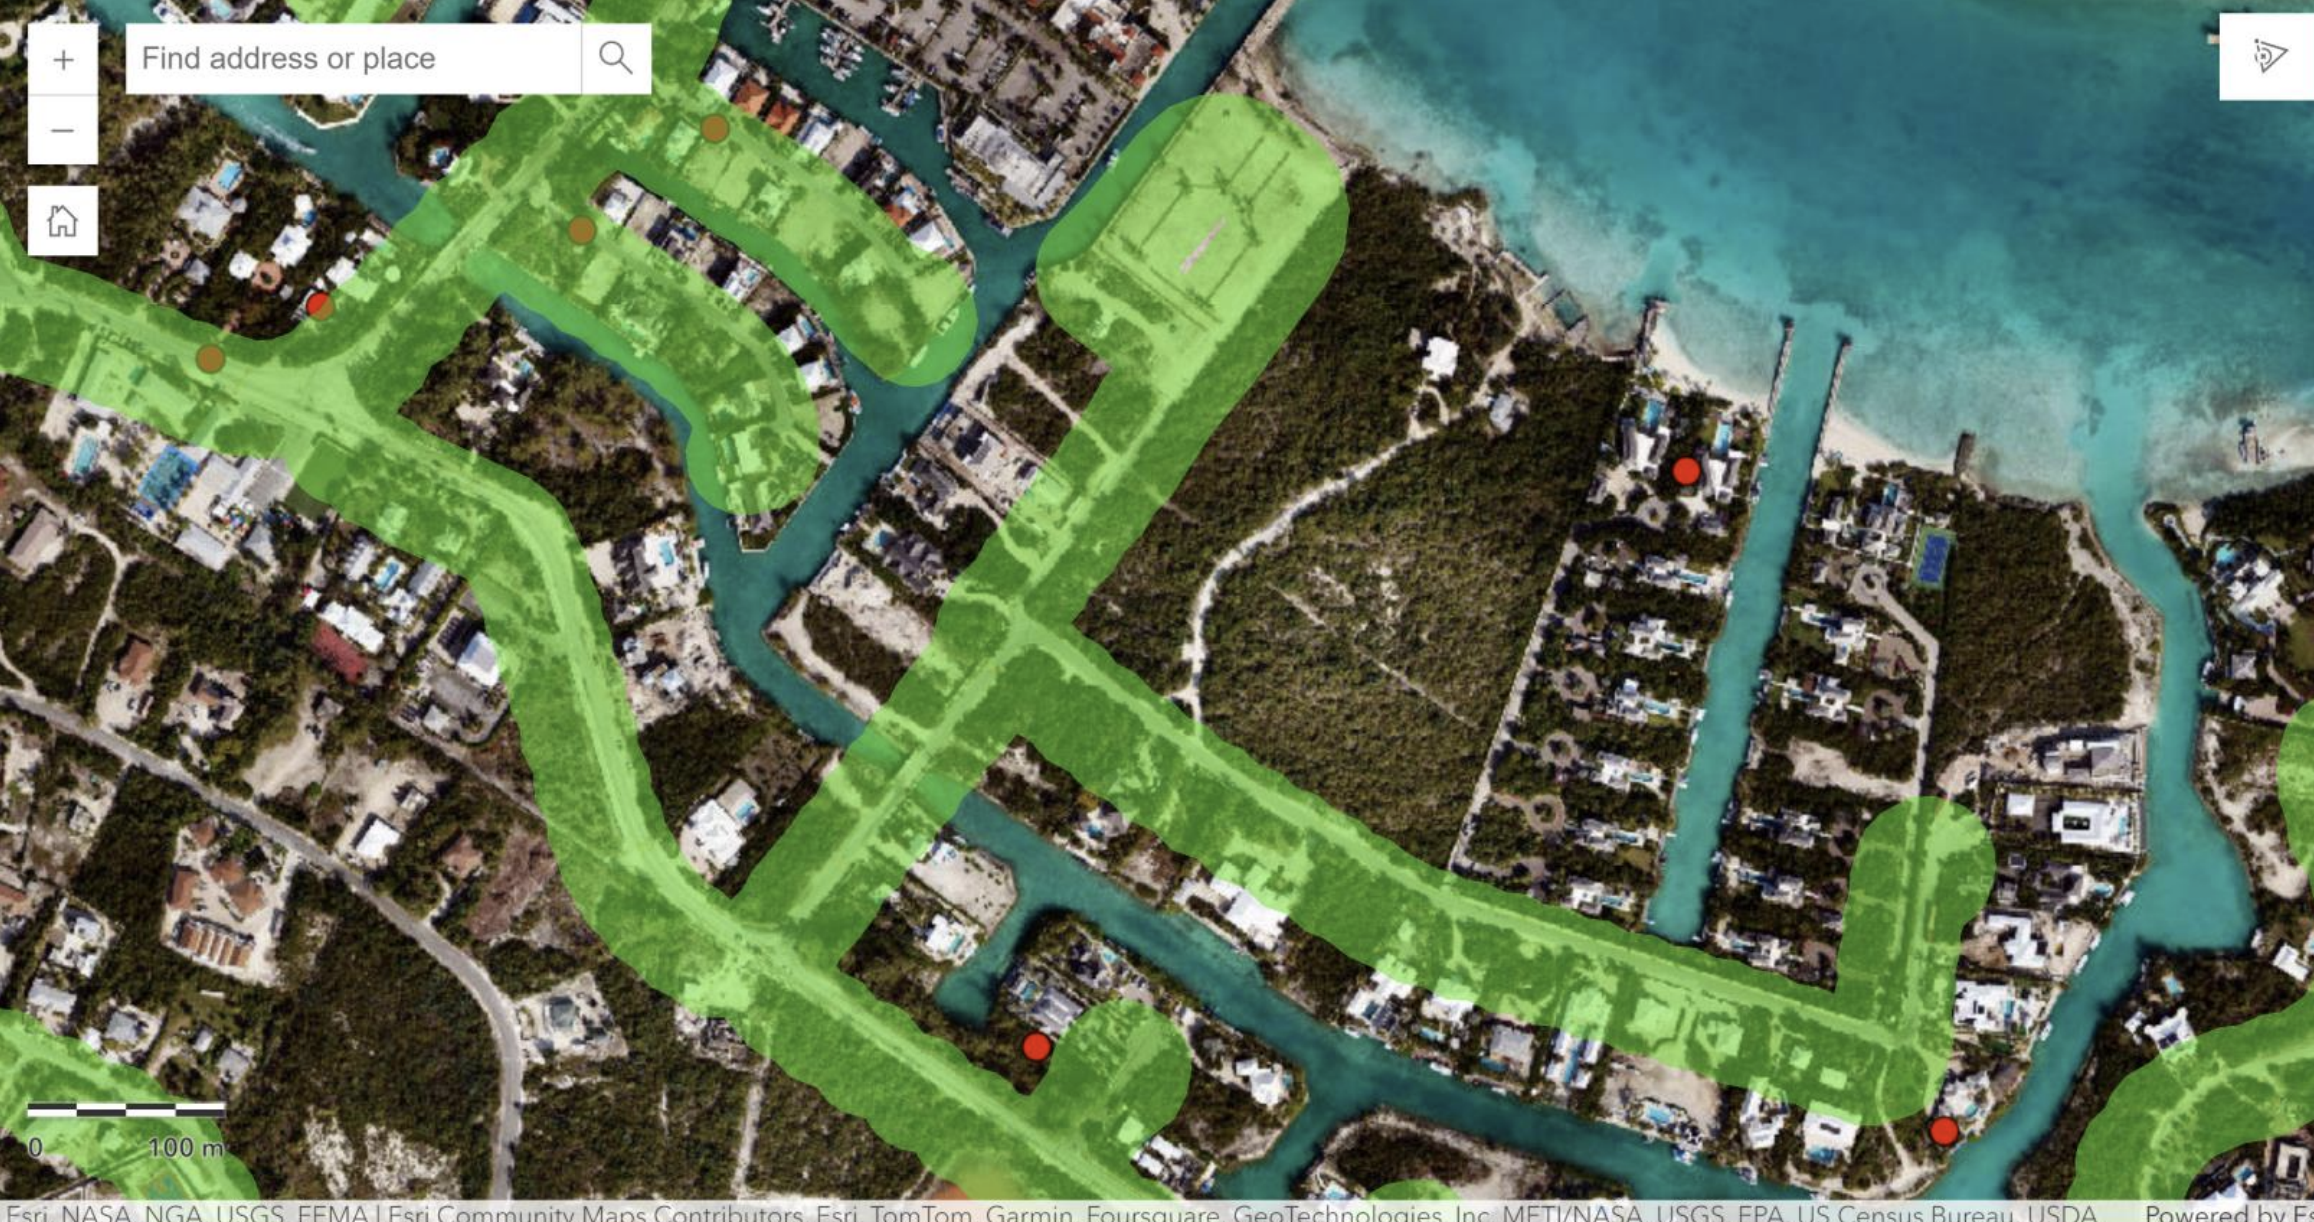
Sales on Channel/Canal
If oceanfront location contributes substantially to property value but the model does not know which properties are oceanfront, it cannot consistently estimate or apply that relationship. The same principle applies to floor area, bathrooms, lot size, pools, age, or any other characteristic that buyers and sellers recognize in the market.
A missing value-related characteristic does not simply make a database less complete. It removes information that may be necessary for the model to explain why otherwise similar properties command different prices.
Preliminary modeling can also inform data development. A land administration could potentially collect hundreds of property characteristics, but every field has a cost to collect, verify, and maintain. Exploratory market analysis can help identify which characteristics appear to contribute useful information and therefore where data-collection and quality-control efforts may warrant greater attention.
Establishing a Baseline
Regression models were first estimated using only the available tabular property characteristics. The initial models explained approximately 55 to 69 percent of the variation in asking prices in the training sample.
The “model fit” alone does not describe all aspects of mass valuation performance. A model can explain a considerable portion of price variation while still producing values that are inconsistent among similar properties or systematically high or low at different points in the value distribution. Ratio studies were therefore used to evaluate accuracy, uniformity, and vertical equity using measures commonly applied in property assessment.
The initial models did not meet the full set of IAAO benchmarks used in the exercise. Testing on the holdout sample indicated poor uniformity and regressive vertical inequity, meaning that higher-value properties tended to receive lower valuations relative to market value, as proxied by the available asking prices.
Additional property information was then incorporated to examine whether it affected both model fit and the resulting measures of valuation accuracy, uniformity, and vertical equity.
What Changed When the Imagery-Derived Data Were Added?
The models were estimated again after the additional characteristics derived from PLACE imagery were included. The expanded models explained approximately 70 to 78 percent of the variation in asking prices in the training sample, compared with approximately 55 to 69 percent using the original variables alone.
The resulting valuations were then tested on a holdout sample of properties that had not been used to estimate the models. This provided an indication of how the models performed when applied to properties they had not previously seen.
The addition of the PLACE-derived characteristics produced improvements beyond model fit. Measures of horizontal equity improved through lower COD values, while the PRD moved closer to 1.00, indicating an improvement in vertical equity. The strongest specification met the IAAO accuracy, uniformity, and vertical equity benchmarks used in the exercise, whereas the models based only on the original variables did not meet the full set of IAAO accuracy, uniformity, and vertical-equity benchmarks used in the exercise. The analysis indicated that part of this improvement was associated with identifying pools and waterfront properties that had previously been missing from the tabular data, particularly among higher-priced properties.
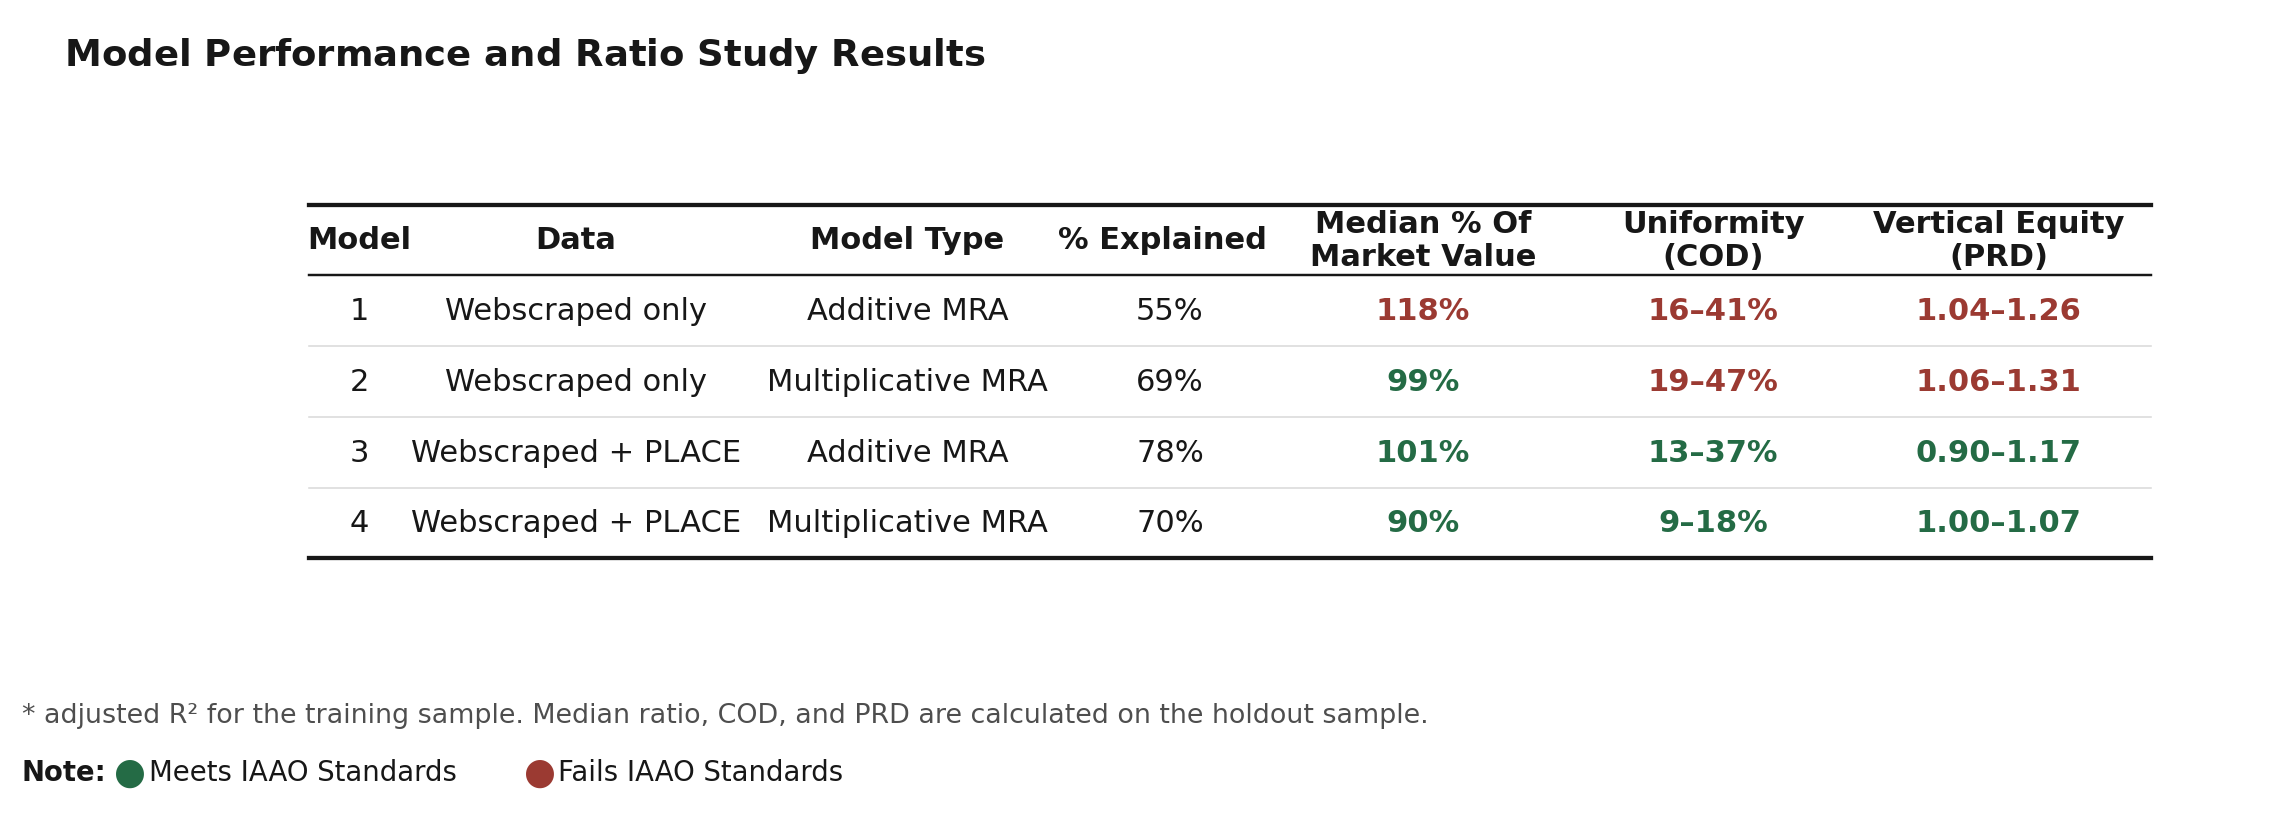
The result was relatively straightforward: the statistical methods were not enough by themselves. The models based on the original property information did not meet the full set of ratio-study benchmarks used in the exercise. After additional information derived from current imagery was incorporated, the models met the accuracy, uniformity, and vertical equity benchmarks.
That result should be interpreted within the limits of this proof of concept. It does not mean that imagery will automatically cause a mass valuation model to pass a ratio study, nor does it validate a production model for the Turks and Caicos Islands. It demonstrates something narrower but important for jurisdictions planning this work: better information about what actually exists on the ground can materially affect both model accuracy and valuation equity.
Which Property Characteristics Appeared Important?
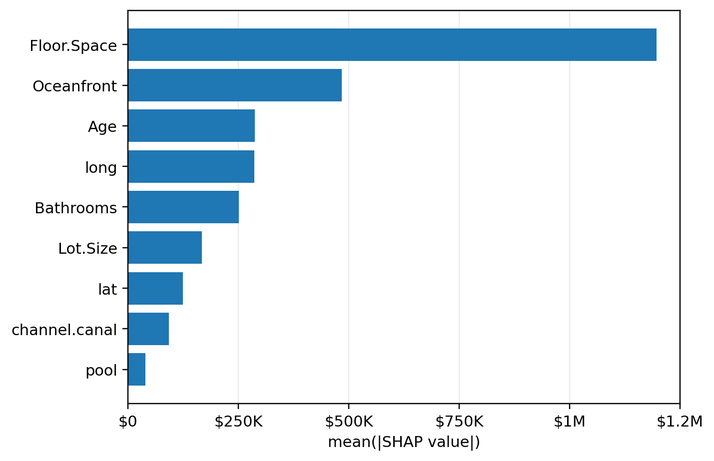
An exploratory XGBoost model and SHAP analysis were also used to examine which characteristics appeared to contribute most to predicted prices. Given the small and non-representative sample, these results were used to identify variables warranting further investigation rather than to establish definitive market effects.
Within this sample, floor area was the strongest predictor, followed by oceanfront status. Age, location, bathroom count, lot size, canal or channel waterfront status, and pool status also provided useful information to the model.
This type of exploratory analysis can also be useful during data development. The results do not establish that a particular characteristic adds a specific dollar amount to market value across Turks and Caicos Islands. Rather, they provide an indication of which characteristics may warrant further investigation and potentially greater attention in data collection, verification, and maintenance.
If floor area repeatedly emerges as one of the strongest predictors of value, for example, it may be worth examining how complete, accurate, and current the existing floor-area records are before relying on them in a production valuation system. With a larger and more representative dataset, the relationships identified here could then be examined more rigorously across different islands, neighborhoods, property types, and value ranges.
Using Current Imagery Across the Broader Cadastre
Mass valuation ultimately requires the resulting model to be applied to the universe of taxable properties. If market analysis indicates that floor area, waterfront status, pools, age, and location help explain differences in value, those characteristics also need to be accurately recorded for the many properties that did not sell.
Current imagery can therefore serve another purpose: helping maintain and verify the property information needed to apply the model across the tax base.
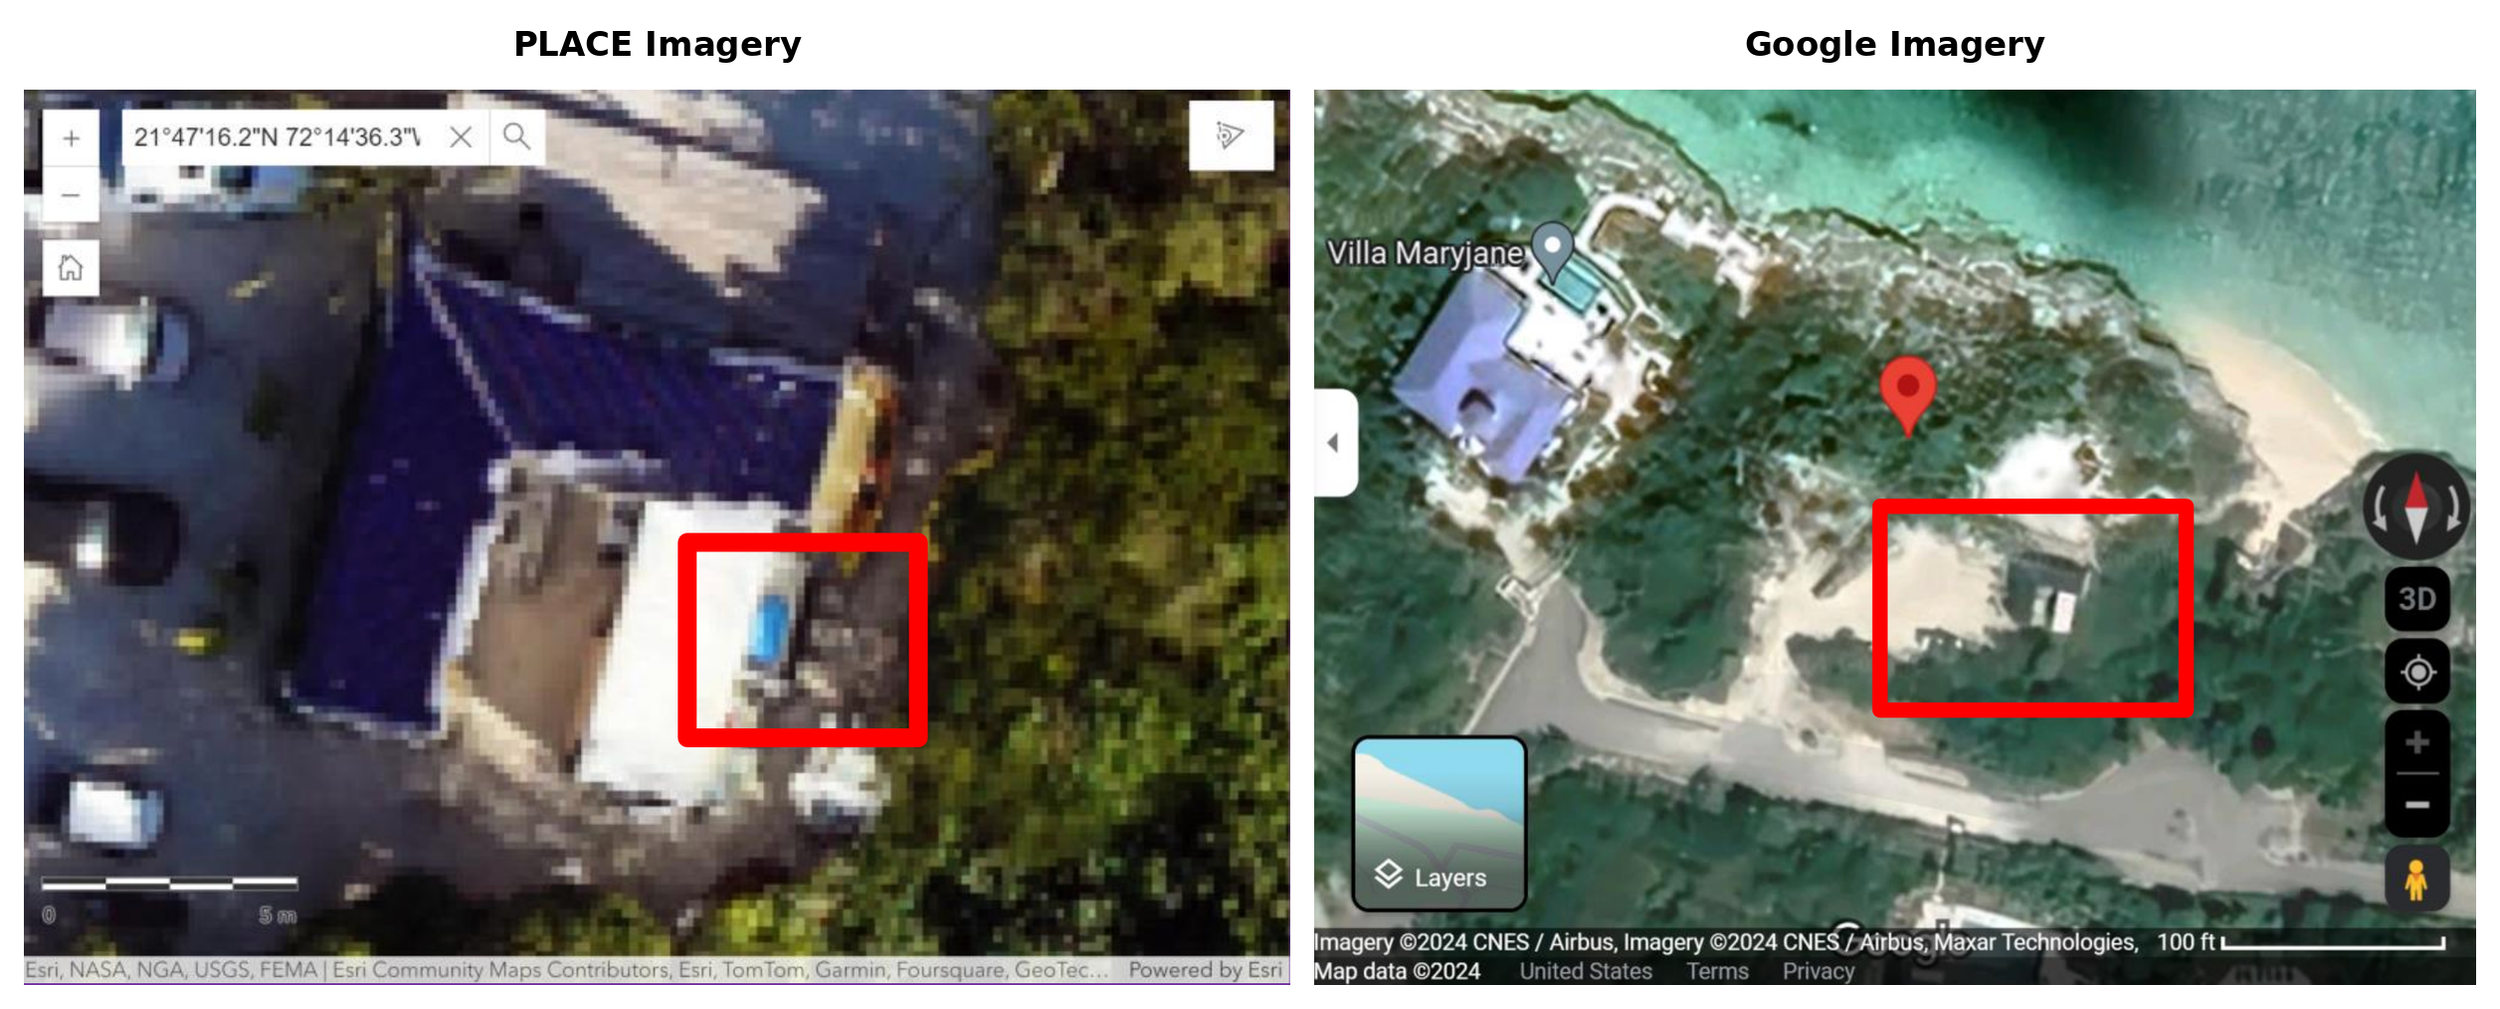
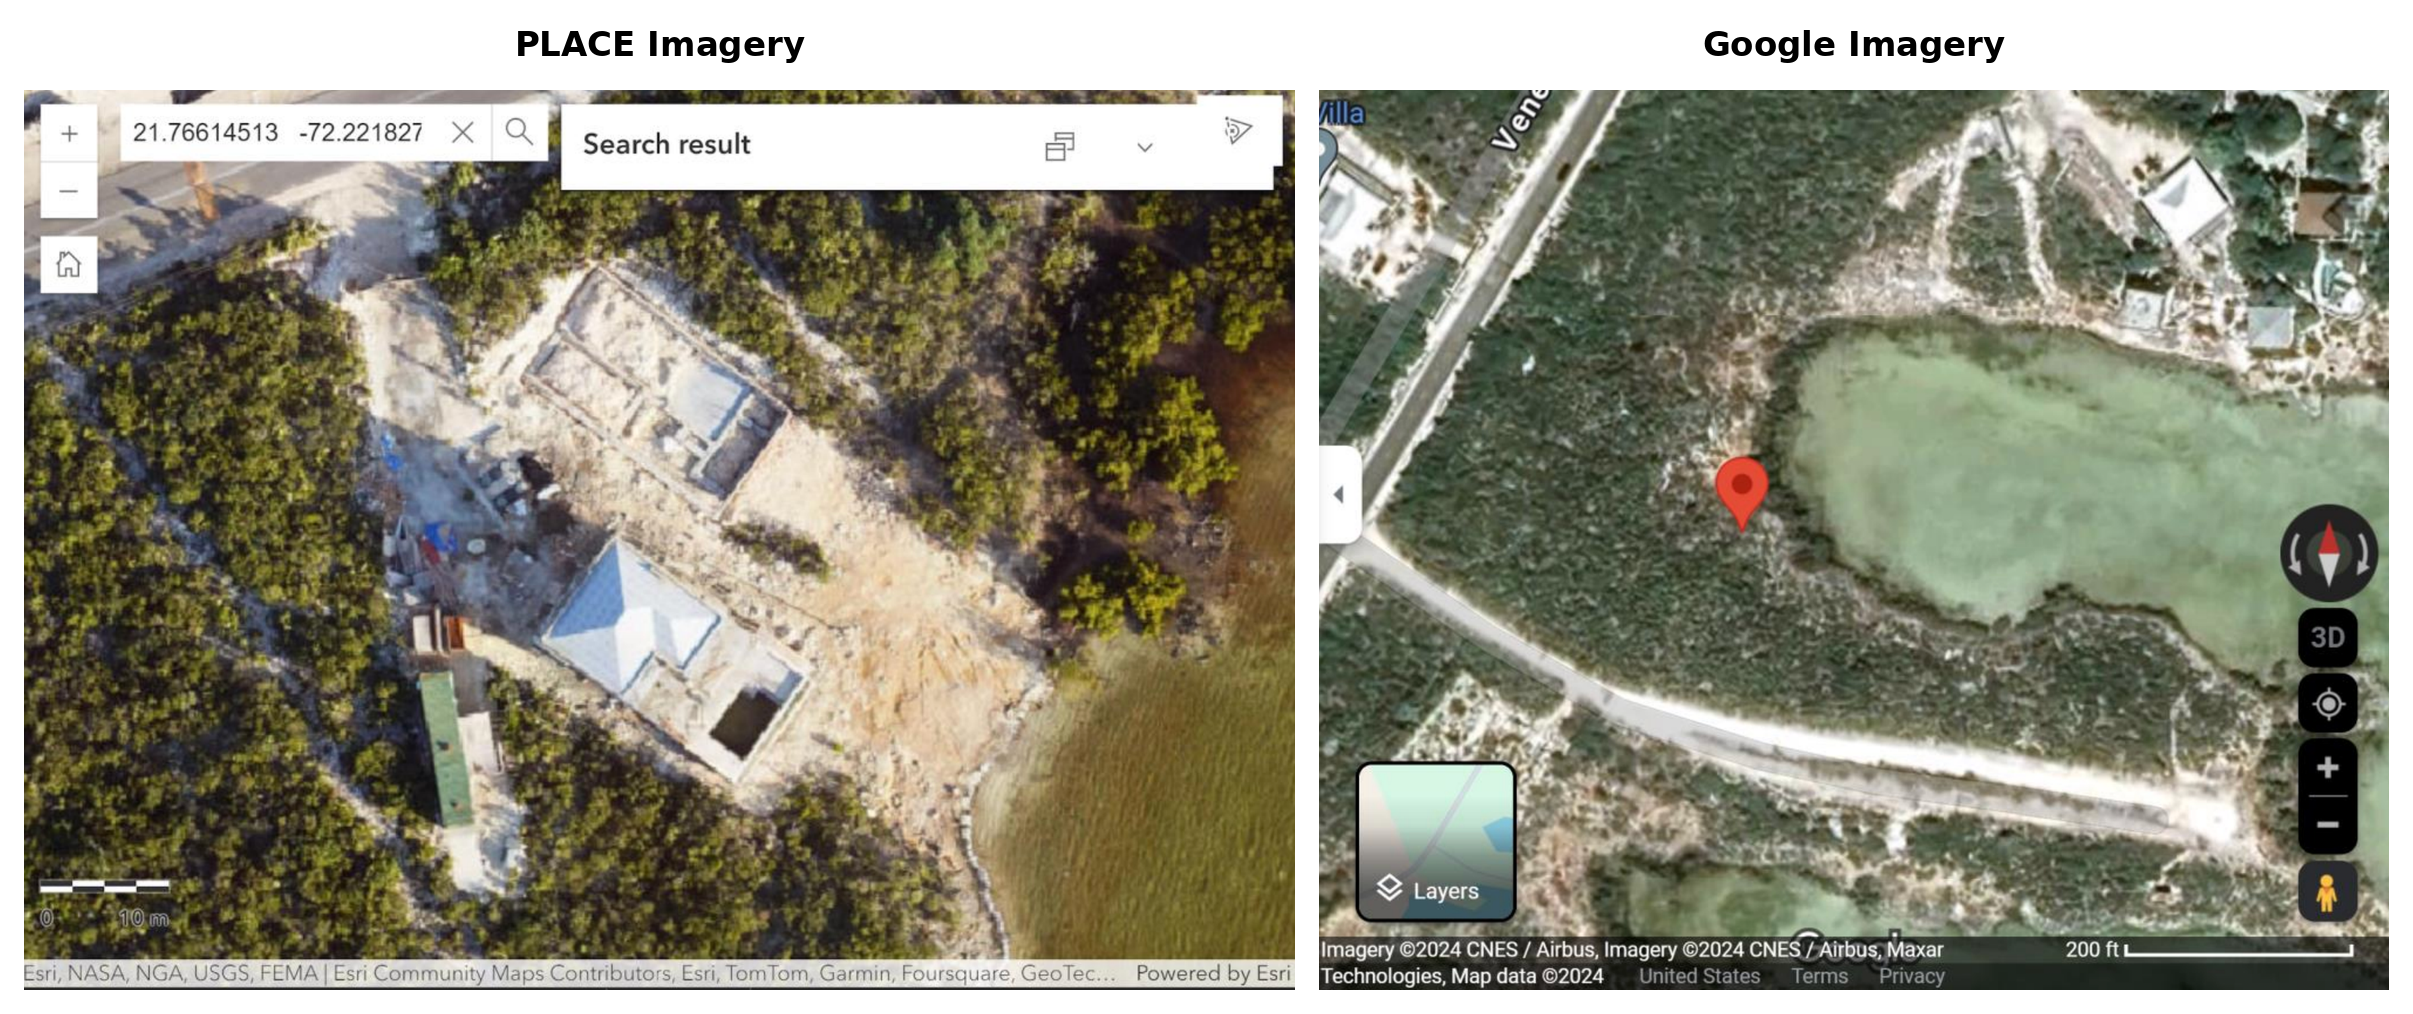
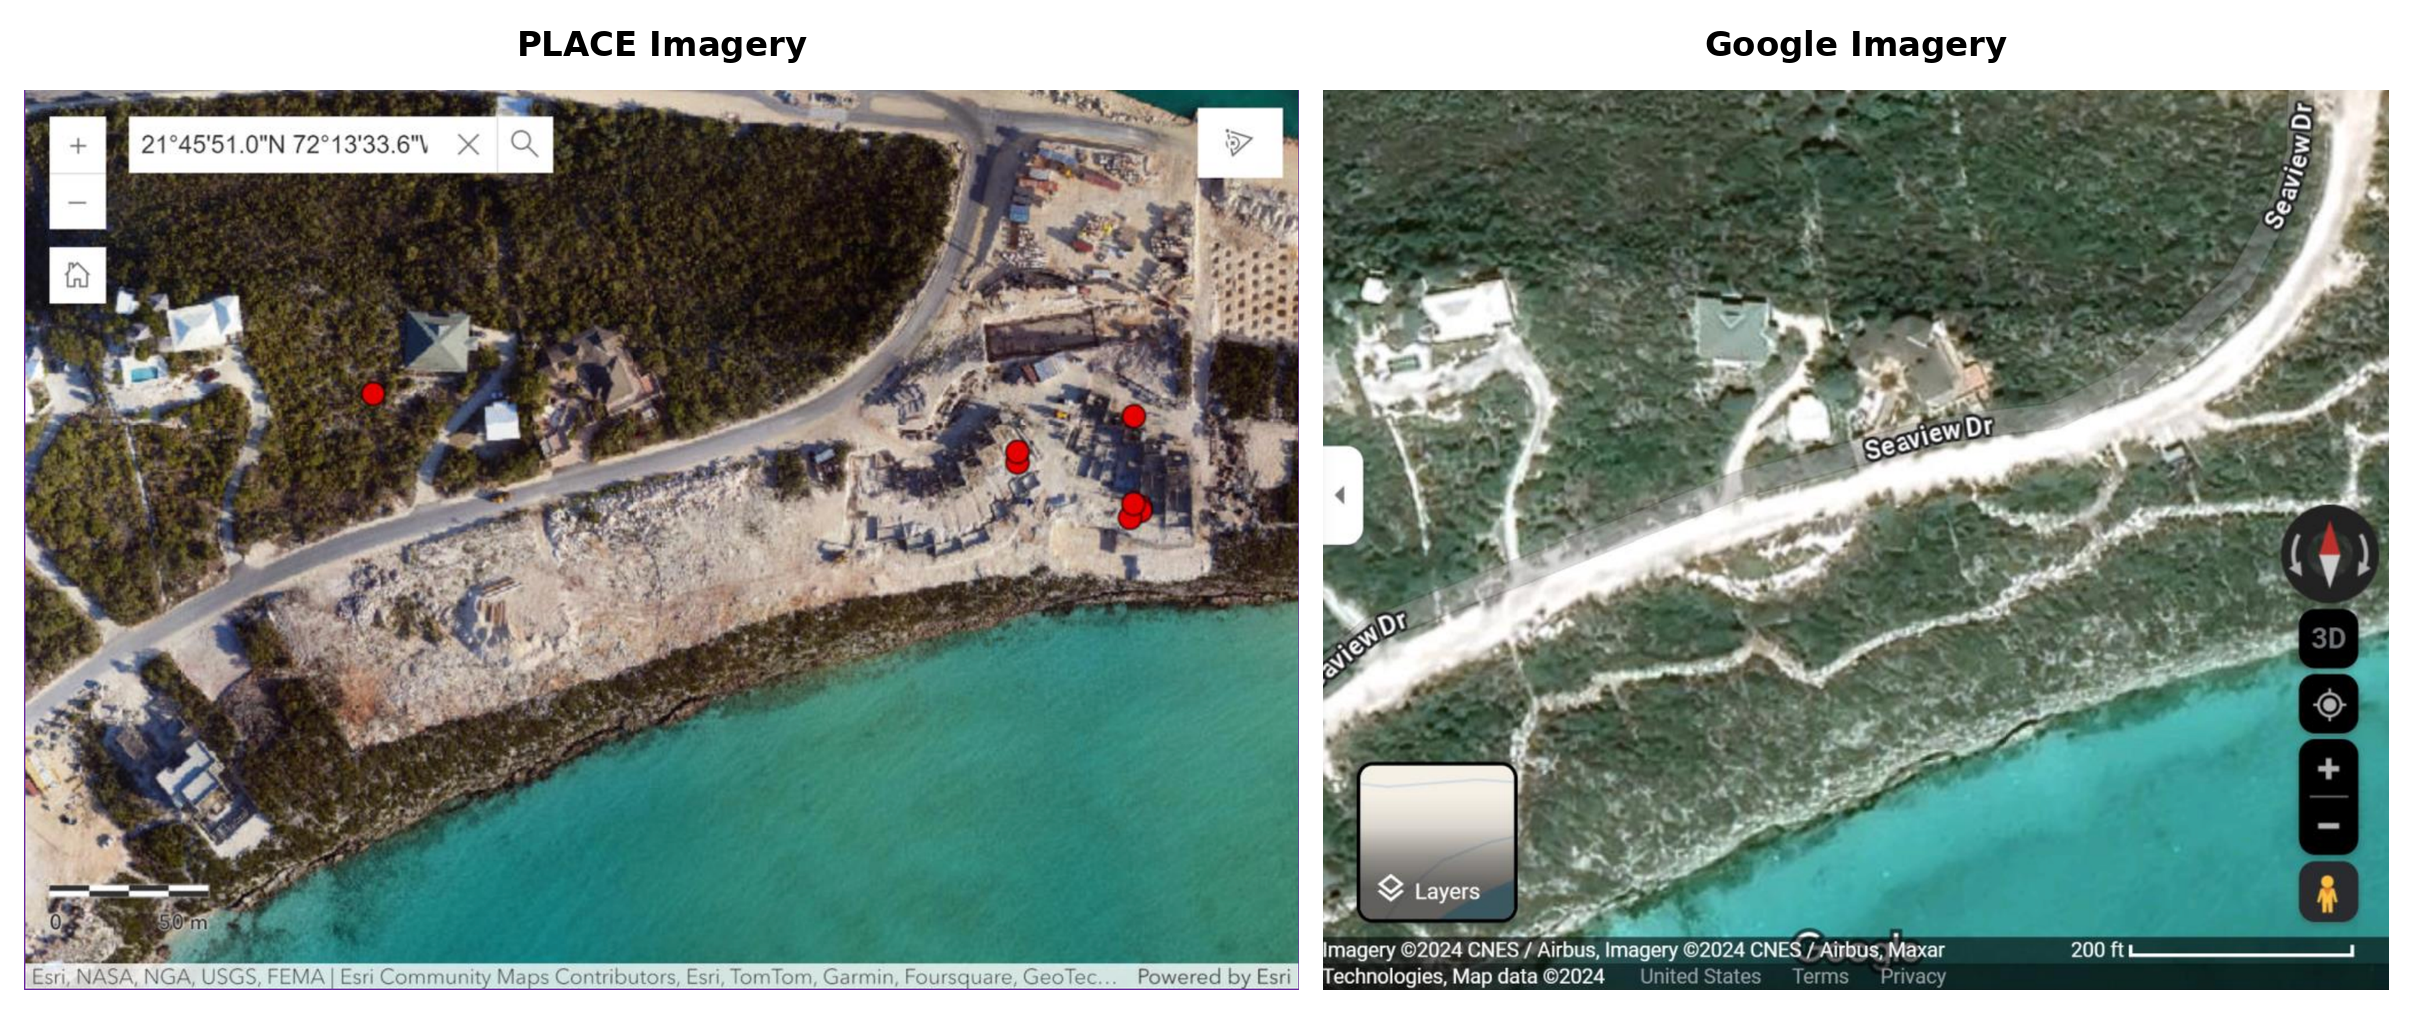
The PLACE imagery provided examples where pools could be identified more clearly because of image quality, color, shading, and resolution, including a pool partially obscured by a canopy. It also showed buildings, newer construction, and completed roads that were absent from older comparison imagery.
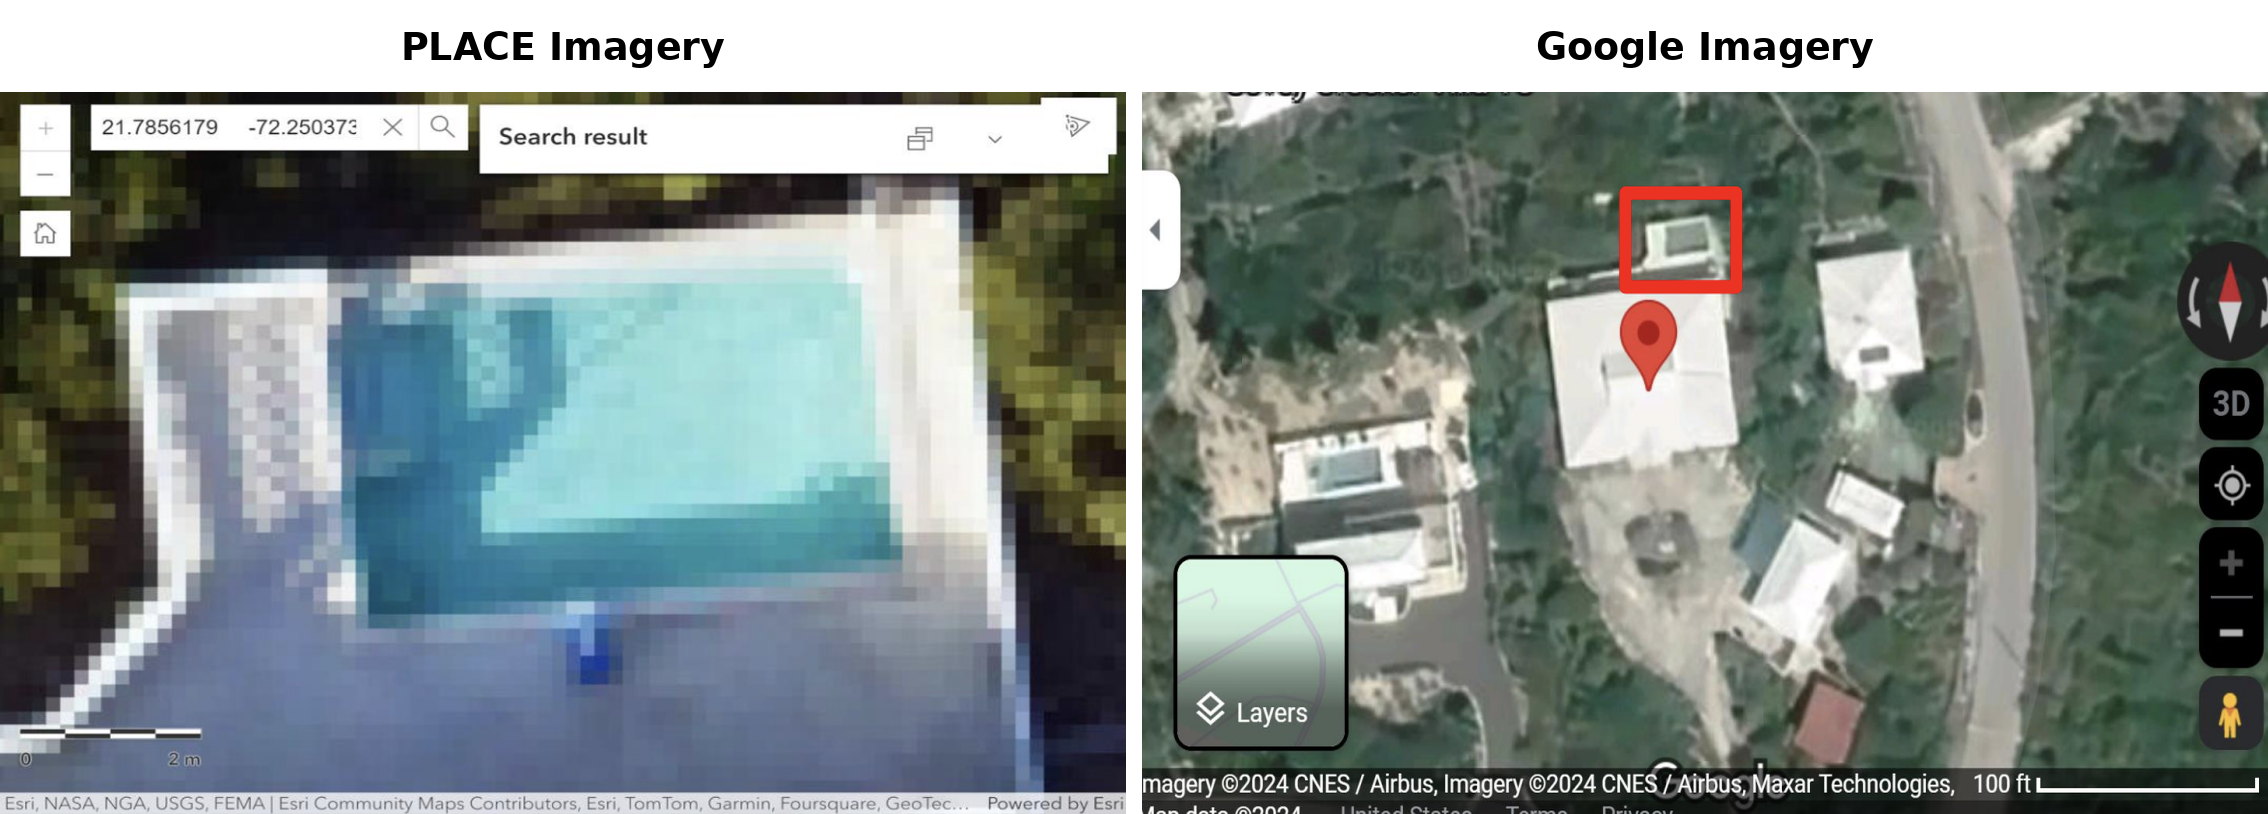
Same-Property Imagery Comparison: Property A
Same-Property Imagery Comparison: Property B
Same-Property Imagery Comparison: Property C
Same-Property Imagery Comparison: Properties D-J
These examples illustrate several different cadastral problems. A pool may exist but be missing from the property record. A building may have been constructed since the previous imagery was captured. A former structure may have been demolished or substantially altered. An area that older imagery shows as vacant may now contain completed development.
If those changes are not reflected in the cadastre, a mass valuation model may be statistically sound and still produce an incorrect taxable value. The model values the property described in the database, not necessarily the property that currently exists on the ground.
PLACE imagery also demonstrated potential for populating or checking building footprints and observable characteristics such as waterfront status, pools, solar panels, and other physical features associated with property value.
Current imagery therefore has three distinct roles in a mass valuation system:
Before modeling, it can help verify and filter the market data used to train the model. A correct price needs to be associated with the correct property and the correct property characteristics.
During model development, it can provide missing characteristics that allow the model to better understand why properties command different prices. In this proof of concept, adding those characteristics made a material difference to both model performance and the ratio-study results.
When values are applied to the tax base, it can help determine whether the broader cadastre still accurately describes the properties being valued. A good model applied to outdated property records can still produce bad taxable values.
Each ultimately affects the accuracy and equity of the property tax.
Conclusions
This proof-of-concept exercise was deliberately limited and should be interpreted accordingly. The 138 listings represented a particular portion of the residential market, asking prices were used rather than a fully researched set of verified transactions, and the exercise did not attempt to develop a production model for every residential property or property class in the Turks and Caicos Islands. A formal pilot intended to support official mass valuation would require considerably broader market evidence, analysis, validation, and quality control.
Within those limitations, the exercise provided useful information at an early stage of the process. The available data contained recognizable relationships between property characteristics and price. The exploratory analysis identified several characteristics that appeared important and therefore worthy of closer attention in future data collection. PLACE imagery also provided a practical way to verify observations, identify questionable records, and add property characteristics that were absent from the original tabular data.
Most importantly, improving the property information produced a material change in the valuation results. Models using only the original information explained approximately 55 to 69 percent of price variation and did not meet the full set of IAAO accuracy, uniformity, and vertical-equity benchmarks used in the exercise. Models containing the additional PLACE-derived characteristics explained approximately 70 to 78 percent and met the benchmarks used in the exercise on the testing holdout sample. The ratio-study results also indicated improvements in horizontal and vertical equity.
The implications for governments extend beyond the performance of these particular models. The usefulness of imagery depends on what can actually be observed from it. Recency, resolution, clarity, color and contrast, viewing angle, coverage, and the availability of aerial and street-level perspectives can all affect its value for property data collection, valuation, and quality control. Some of the characteristics identified here could also be obtained from other imagery sources. This exercise was not designed to compare imagery providers, although the comparisons made during the work illustrated practical differences in what could be observed and verified from the imagery available.
Imagery should itself be subject to quality control. A displayed imagery or copyright date does not necessarily establish when the image of a particular property was captured. During this exercise, the apparent condition of some properties did not appear consistent with the dates displayed by the imagery platforms. Trust, but verify. Where recency matters, acquisition dates and observable property conditions should be checked where possible rather than assumed from a displayed platform date alone.
Higher-quality and more frequently collected imagery may also create opportunities to automate portions of cadastral maintenance and quality control. Computer vision and other AI methods can help identify observable characteristics, detect changes between collection periods, compare imagery with existing property records, and flag potential discrepancies for human review. This does not require fully automated database maintenance. Automated methods can instead help direct trained staff toward properties and records that warrant closer examination.
More complete and current property data can also reduce avoidable taxpayer inquiries and appeals. If a pool is missing from the government database and the resulting assessment is too low, the taxpayer has little incentive to report the omission. If the database records a pool that does not exist and the resulting assessment is too high, the taxpayer has a much stronger incentive to challenge the value. These errors can result in additional reviews, inspections, corrections, appeals, staff time, administrative expense, and reduced public confidence. Identifying observable discrepancies before values are issued can therefore improve both valuation quality and the administration of the resulting tax.
Property data are the ingredients from which a mass valuation system ultimately produces taxable values. Better statistical methods can make better use of those ingredients, but they cannot fully overcome information that is missing, incorrect, or years out of date. The model may calculate the value, but the data determine what property the model sees.
For land and property administrations developing mass valuation, keeping the data accurate, complete, current, and comprehensive is therefore not secondary to the modeling work, but part of the valuation system itself.
Keywords: Mass valuation, property tax, mass appraisal, Turks and Caicos Islands, land administration, land valuation